Current Scenario In Indian Banking Sector – NPA Mess
This blog is in continuation to our blog series on Banking sector, where we have tried to explained the Banking sector as whole from scratch (explaining the terms and jargons) and have deep dived into how Indian Banking sector has evolved over decades. In the current blog we focus on the current scenario of the sector, explaining NPA mess and the competition the sector is facing from Non-Banking companies.
Recent Updates On Indian Banking Sector
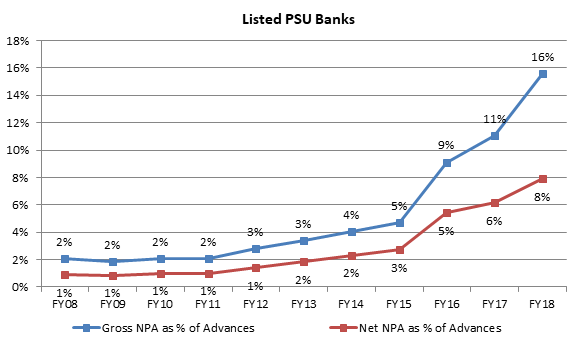
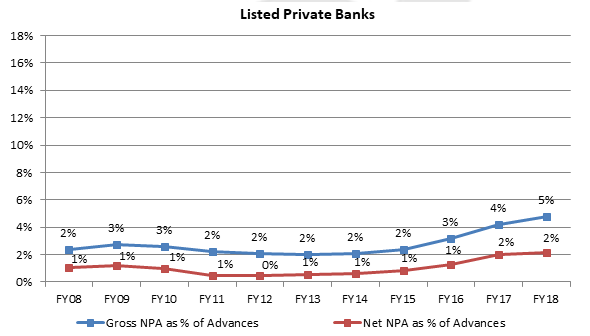
The Gross NPA of Indian Banking sector has increased from ~2.5 lac cr in FY14 to over 10 lac cr. This has lead to aggressive provisioning by banks. The provisioning by PSU banks itself has increased from ~75,000 cr in FY14 to ~250,000 cr in FY18. PSU banks have cumulatively provided ~10% of their FY18 advances in last 3 years!! (~5.5 lac cr +), whereas private banks have provided ~4% (1 lac cr +). The cumulative provisions in last 3 years are more than the provisions in a decade from 2005 to 2014!!
Let us see the Gross NPA trajectory of these banks in the past :
| Bank | FY09 Gross NPA (Cr) | FY14 Gross NPA (Cr) | FY18 Gross NPA (Cr) |
| State Bank of India | 15,714 | 61,605 | 2,23,427 |
| Bank of Baroda | 1,843 | 11,876 | 56,480 |
| IDBI Bank | 1,436 | 9,960 | 55,588 |
| Punjab National Bank | 2,767 | 18,880 | 86,620 |
| Canara Bank | 2,168 | 7,570 | 47,468 |
| HDFC Bank | 1,988 | 2,989 | 8,607 |
| Kotak Mahindra Bank | 689 | 1,059 | 3,825 |
| ICICI Bank | 9,649 | 10,506 | 53,240 |
| Axis Bank | 898 | 3,146 | 34,249 |
| IndusInd Bank | 255 | 621 | 1,705 |
| Yes Bank | 85 | 175 | 2,627 |
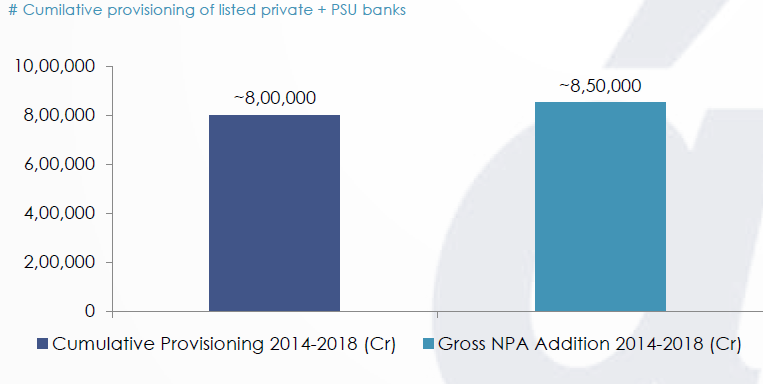
Cumulative Provisioning, Is The Worst Over ? :
Let us have a look at cumulative provisioning post 2014 for few banks v/s. their provisioning during FY09 to FY14 period. You can see that most of the banks have provided way more in last 4 years than what they had during FY09-14 period!
| Bank | FY 2009 – 2014 Cumulative Provisioning (Cr) | FY 2015 – 2018 Cumulative Provisioning (Cr) |
| State Bank of India | 58667 | 1,60,739 |
| Bank of Baroda | 13507 | 43307 |
| IDBI Bank | 12147 | 44121 |
| PNB | 19494 | 67498 |
| Canara Bank | 11508 | 37166 |
| HDFC Bank | 11066 | 14321 |
| Kotak Bank | 1337 | 2859 |
| ICICI Bank | 16494 | 48083 |
| Axis Bank | 8607 | 33627 |
| IndusInd Bank | 1425 | 3328 |
| Yes Bank | 965 | 3223 |
There has been a bloodbath in PSU banks earnings. Their profits are wiped out since they had to provide for non performing assets. With gross NPA’s at 16-17% of overall advances, and most of it has been provided for. Steel sector is in a strong upcycle & domestic demand is getting stronger. Banks will be able to get rid of steel assets at a reasonable haircuts. Steel is almost fixed & there could be potential write backs by banks on that front. Unless we get some more negative suprises from real estate – builder financing, housing loans or power sector, the gross NPA situation is somewhere near peaking out.
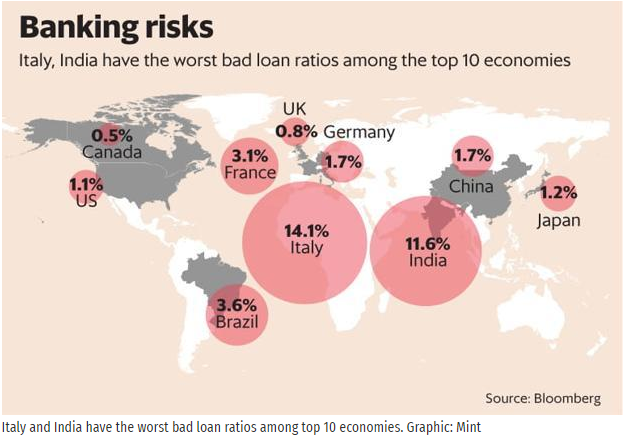
Amongst the top 10 economies, India has one of the worst bad loan ratios.
Due to this mess created in the banking sector, government has taken number of steps like the Prompt Corrective Action (PCA), Project Shashakt, SAMADHAN scheme, IBC, etc.
Prompt Corrective Action (PCA) :
PCA is like an intensive care unit where banks with weaker balance sheets are being cured with various steps taken by the government and RBI. These banks are restricted from opening new branches, staff recruitment and increasing the size of their loan book depending on the risk thresholds set in PCA rules. Additionally, PCA banks are directed to disburse loans to only those companies whose borrowing is above investment grade. Currently, there is a list of 11 banks which are currently under PCA framework and 6 more PSU banks are under consideration to be added to the PCA framework.
| PCA List | Watchlist | Non PCA |
| Allahabad Bank | Punjab National Bank | State Bank Of India |
| United Bank of India | Canara Bank | Bank Of Baroda |
| Corporation Bank | Union Bank of India | Indian Bank |
| IDBI Bank | Syndicate Bank | Vijaya Bank |
| UCO Bank | Andhra Bank | |
| Bank of India | Punjab & Sind Bank | |
| Central Bank of India | ||
| Indian Overseas Bank | ||
| Oriental Bank of Commerce | ||
| Dena Bank | ||
| Bank of Maharashtra |
RBI has defined three risk thresholds for each parameter and it has linked specific corrective measures to each threshold. Breach of any risk threshold would result in invocation of PCA. If the risk is higher, then the corrective action will be tougher for the bank.
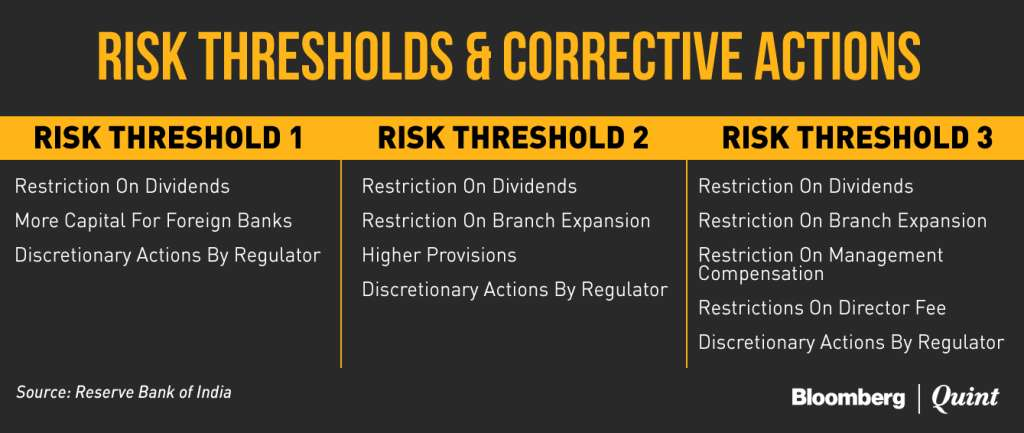
Banks would fall under different categories of risk based on their NPAs. The NPA range for adding a bank to any risk category has been conservatively updated by the RBI from the earlier rules. So now even at lower Net NPA range a bank would get added to the PCA list.
| Net NPA Range | Risk Category | Earlier NPA Range |
| 6 – 9 % | Category 1 | 10 – 15 % |
| 9 – 12 % | Category 2 | 15 % + |
| 12 % + | Category 3 | NA |
Shashakt Plan :
It is a project recommended by a panel headed by PNB chairman Sunil Mehta. As per the plan:
- Bad loans of up to ₹50 crore: These accounts will be managed at the bank level, with a deadline of 90 days.
- Bad loans of ₹50-500 crore: The banks will enter an inter-creditor agreement, authorizing the lead bank to implement a resolution plan in 180 days, or refer the asset to NCLT.
- Bad loans above ₹500 crore: The Sunil Mehta panel recommended an independent AMC, supported by institutional funding through the AIF (Alternative Investment Funds). There are about 3.6 lac cr of loans in this range, with PSU banks exposure of around 3.1 lac cr.
SAMADHAN Scheme :
This scheme is targeted towards addressing stressed power assets. This scheme has shortlisted 11 power assets with an overall capacity of over 12 GW, which are either nearing completion or complete, like Lanco Infratech’s Anpara power plant, Jaypee Power Ventures’ Nigrie power plant and KSK Mahanadi plant in Chhattisgarh. The scheme attempts at saving these assets to be sold at Rs. 1-2 cr per MW against investment of Rs.6-7 cr per MW, by assessing the sustainable debt in each of these assets and converting the remaining unsustainable debt into equity (held by banks), with 24.5% to be allowed to be remained by the promoters.
Insolvency and Bankruptcy Code (IBC) And Its Impact
Historically, banks used to prefer Corporate Debt Restructuring (CDR) or Joint Lenders Forum (JLF) mechanisms for restructuring the debt of stressed borrowers. The objective of the extensively used CDR seemed to have been to provide temporary relief to the borrower rather than efforts towards reviving the business. CDRs had met with limited success of only 17% exits as of June 2016 due to poor evaluation of business viability and the lack of effective monitoring.
Strategic Debt Restructuring (SDR) was introduced in June 2015. Until then, there was no such mechanism that enabled the banks/lenders to play a direct role in the turnaround of stressed borrowers. However, banks due to the expectation that the existing legal system would not allow a change of management to take place smoothly, banks were skeptical of lack of protection from existing and imminent litigations and this impacted the success of SDR.
Scheme for Sustainable Structuring of Stressed Assets (S4A) was introduced in June 2016. Under S4A, existing promoter may continue to enjoy the control as long as 50% of the debt is ‘sustainable’. The efficacy of S4A is yet to be evaluated, however, the lack of emphasis on a comprehensive turnaround could possibly result in the problem just being postponed.
Before the introduction of IBC, many corporates used to quite easily get loans irrespective of their capabilities of repaying the loans. Infact, many times the companies would get loans to service the interest costs of their previous loans! The promoters did not have much fear of losing their company in case of defaulting on the loans. This led to Crony capitalism and unhealthy credit quality in the system. Also, this lead to over capacities in many industries leading to comparatively lower capacity utilization. We can see in the industry wise capex funded by Banks/FIs, that most of the industries had maximum capex during FY2009 to FY2014 period:
| Industry wise Capex Funded by Banks/FIs – (Rs. Cr) | |||
| Industry | 2017 Capex | Max Capex | Max Capex Year |
| Infrastructure | 1,13,200 | 2,01,500 | 2011 |
| i) Power | 82,400 | 1,73,300 | 2011 |
| ii) Telecom | – | 67,200 | 2010 |
| iii) Ports & Airports | 10,200 | 10,200 | 2017 |
| iv) Storage & Water Management | 6,600 | 6,600 | 2017 |
| v) SEZ, Industrial, Biotech and IT Park | 700 | 12,400 | 2008 |
| vi) Roads & Bridges Construction | 13,200 | 13,200 | 2017 |
| Construction | 21,600 | 47,100 | 2010 |
| Metal & Metal Products | 8,800 | 79,200 | 2011 |
| Transport Equipment & Parts | 7,900 | 9,300 | 2009 |
| Textiles | 7,300 | 13,400 | 2012 |
| Cement | 4,000 | 18,700 | 2009 |
| Chemicals & Pesticides | 3,800 | 6,700 | 2012 |
| Hospitals & Health services | 2,000 | 3,700 | 2010 |
| Food Products | 1,600 | 3,100 | 2009 |
| Hotel & Restaurants | 1,500 | 13,100 | 2011 |
| Glass & Pottery | 1,100 | 2,500 | 2012 |
| Petroleum Products | 900 | 17,200 | 2008 |
| Transport Services | 700 | 5,700 | 2010 |
| Mining & Quarrying | 700 | 10,200 | 2010 |
| Sugar | 200 | 3,700 | 2009 |
| Electrical Equipment | 400 | 7,500 | 2011 |
| Others | 7,100 | 19,100 | 2008 |
| Total Cost of Projects | 1,82,800 | ||
Also, the manufacturing capacity utilisation levels started to fall from 2011, due to addition of capacities. The capacities were added way ahead of demand growth expectations as banks were relentlessly lending. This is also a leading factor for lower capex from manufacturing side during past few years as utilisation levels were already low and have just started catching up since a year.
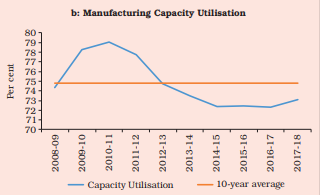
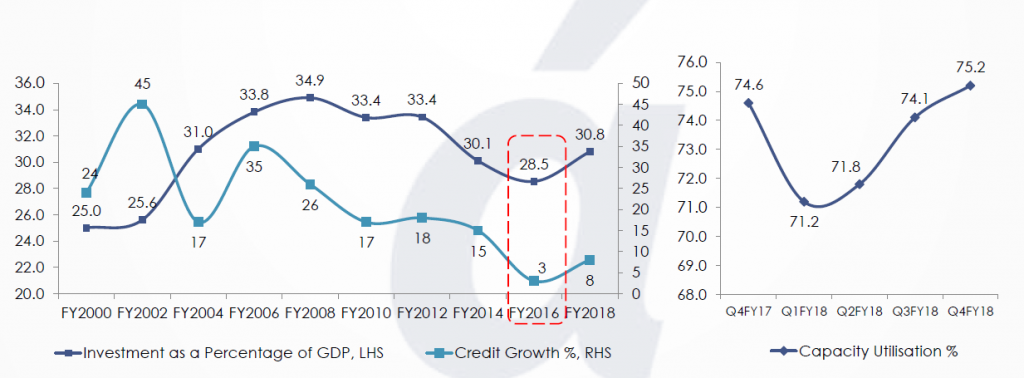
It looks like we are past the trough in terms of investment cycle slowdown. Capacity utilizations across heavy industries is picking up & a fresh capex cycle may start once we cross 85%-90% kind of a number. Recently we saw Arcelor Mittal revising its bid for Essar Steel’s 10 MT plant from 37000 cr to 42000 cr. This could be the sign of things to come our way. Corporate sector seems to be confident of the recovery.
And the best part is, all those crooks who looted the system, are all set to lose their empires just when things are turning around.
IBC Could Be The Single Biggest Reform Of Modi Government !
- A certain path was taken – Original idea was to create a bad bank, where all bad loans will be transferred. However PSU banks would not have learnt any lesson & they would have continued with old practices. I
- BC was important to force a cultural change in how PSU banks operate. Under IBC regime banks will be forced to write the assets down, industry wont get capital as PSU banks are under pressure. Banks are quickly referring cases to NCLT & trying to recover the money.
- IBC enforces the principle of creative destruction. If companies fail, there will be no more ever greening of loans. Companies will be auctioned / sold off & old entrepreneurs will lose control.
- This creates a rule based economy & which is a sign of a living and thriving business culture. The old context of “nothing will happen even if we default” needed to be changed. And that’s what IBC has achieved.
- Promoters will now have the fear of losing their company if they do anything wrong or cheat banks.
Banks are in a much better position to recover their money in case of default.
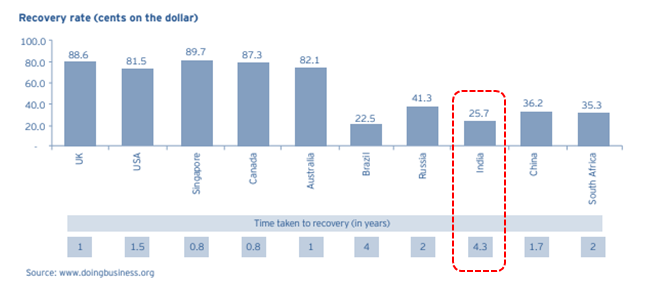
India’s insolvency ranking before the approval of IBC was very bad, compared to other BRICS and developed nations.

Also the recovery rates and the time taken for recovery was worse compared to other nations. Indian banks took 4.3 years to recover the bad debts, which is longest compared to other nations. Also, only 25.7 % of stressed assets was being recovered.
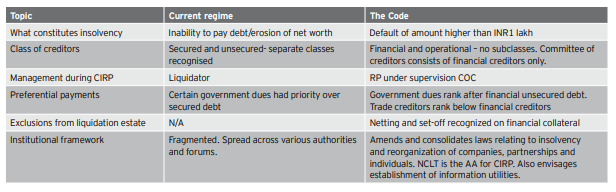
IBC was approved by both houses of the Parliament of India and received presidential assent in May 2016 and it was made effective on 1 December 2016. The key difference between IBC and the current regime is as following:
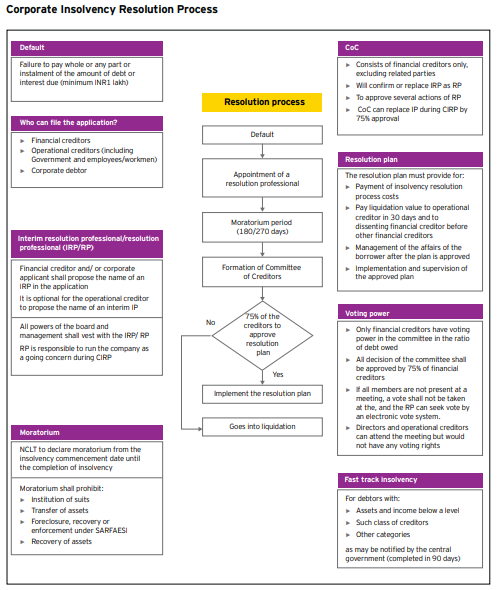
The IBC process in a nutshell is explained by the chart below:
Post the approval of IBC, the number of corporate undergoing insolvency resolution processes have increased.
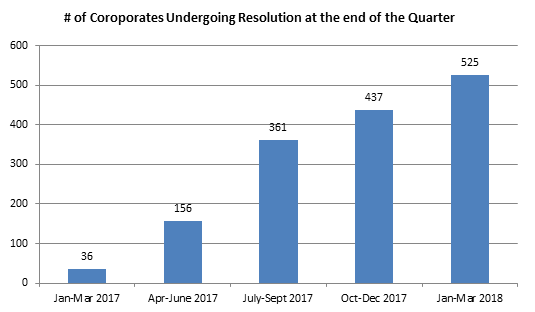
Post the IBC code, as the number of insolvency cases have started to increase, promoters have started to fear that they can lose the control of their company if they don’t repay the loans. This has led to more cautious addition of loans on the balance sheet and reduction of Crony capitalism in the system.
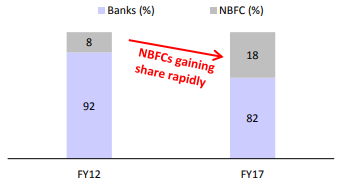
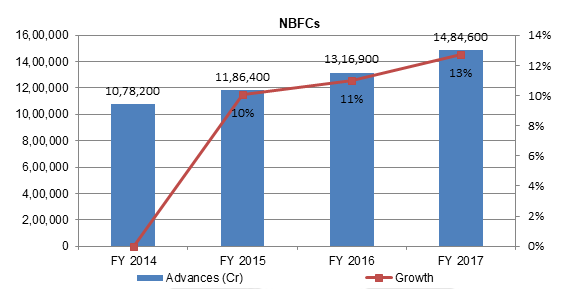
Competition From Non-Banking Sector
Non-Banking Firms
The share of non-banking sector in credit is increasing. NBFCs are way ahead in terms of technological advancements, and this has helped them in gaining market share in lower ticket size loans. On the contrary, there has been little innovation in banking except of use of computers, setting up mobile applications, etc. NBFCs are far quicker and more convenient in loan disbursements.
Interestingly, some consumer durable manufacturers use financing options as indirect marketing option for their product. These subventions provide better results than a consumer durable company’s marketing spends. A consumer would avail 0% interest consumer loan from an NBFC, with a duration of less than a year and down payment of ~30%. The NBFC would earn 1-1.5% from processing fee and spread from the manufacturer who would indirectly pay his marketing spend savings to the NBFC. NBFCs are becoming the go-to lenders for youngsters in India.
Initiatives Taken By Banks To Retain Their Market Share
Banks have started to invest in FinTech companies to compete with the NBFCs. Some of the examples are:
|
Bank |
FinTech Acquired/Collaborated |
|
Yes Bank |
Ties up with PhonePe (UPI app), Trupay, Capital Flow, Mypoolin, Ubona, Tonetag & Rupee Power |
|
Axis Bank |
Acquired Freecharge |
|
HDFC Bank |
Ties up with UPI app Chillr |
|
HDFC & ICICI Bank |
Tie up with ftcash |
|
SBI Bank |
Formed a blockchain forum called Bankchain |
|
RBL Bank |
Ties up with 80 Startups; Launched exclusive branch in Koramangala |
|
Bank of Baroda |
CreditMantri, FundsTiger, Probe42, Power2SME, IndiaLends, KredX, Fisdom |
Infact, these banks already have huge amount of data of all their existing customers. They have credit history of millions of their existing customers which they can leverage, and coupled with better technology and data analysis, grow in retail lending. Whether banks are able to do this or not, only time will tell.
Disclaimers :
The information herein is used as per the available sources of bseindia.com, company’s annual reports & other public database sources. Alpha Invesco is not responsible for any discrepancy in the above mentioned data. Investors should seek advice of their independent financial advisor prior to taking any investment decision based on this report or for any necessary explanation of its contents
Future estimates mentioned herein are personal opinions & views of the author. For queries / grievances – support@alphainvesco.com or call our support desk at 020-65108952.
SEBI registration No : INA000003106
Readers are responsible for all outcomes arising of buying / selling of particular scrip / scrips mentioned here in. This report indicates opinion of the author & is not a recommendation to buy or sell securities. Alpha Invesco & its representatives do not have any vested interest in above mentioned securities at the time of this publication, and none of its directors, associates have any positions / financial interest in the securities mentioned above.
Alpha Invesco, or it’s associates are not paid or compensated at any point of time, or in last 12 months by any way from the companies mentioned in the report.
Alpha Invesco & it’s representatives do not have more than 1% of the company’s total shareholding. Company ownership of the stock : No, Served as a director / employee of the mentioned companies in the report : No. Any material conflict of interest at the time of publishing the report : No.
The views expressed in this post accurately reflect the authors personal views about any and all of the subject securities or issuers; and no part of the compensations, if any was, is or will be, directly or indirectly, related to the specific recommendation or views expressed in the report.
Stay Updated With Our Market Insights.
Our Weekly Newsletter Keeps You Updated On Sectors & Stocks That Our Research Desk Is Currently Reading & Common Sense Approach That Works In Real Investment World.