Disclaimer: The Blog on ‘Fertilizer’ is not a recommendation to buy / hold / sell any stock. The published post is for information purpose only. Please read the detailed disclaimer at the bottom of the post.
Introduction
Fertilizer is a chemical product that is applied to the soil to supply it with essential nutrients for the growth of the plant. These fertilizer are classified as
- Primary
- Secondary
- Micronutrients
Primary fertilizers are further classified on the type of nutrients they supply to soil such as nitrogenous, phosphatic and potassic fertilizers.
Secondary fertilizer includes calcium, magnesium and sulphur while micronutrients include iron, zinc, boron, chloride etc.
Under the nitrogenous category which is a primary fertilizer most widely used fertilizer is urea.
DAP and MOP fertilizer fall under the phosphatic and postasium fertilizer category respectively and these are again primary fertilizers.
Urea production dominates the fertilizer production in the country. While India is the second largest consumer of urea, GOI is working towards increasing the production of urea so as to end all urea imports by 2022.
DAP is the second most used fertilizer after urea and after the recent fall in the prices of key raw material used in making DAP, India has started to manufacture DAP which was imported previously.
GOI is also encouraging the use of SSP which is considered a substitute of DAP.
Urea
Urea is the source of nitrogenous fertilizer and it is heavily subsidized by the GOI. Today urea is the only fertilizer which remains controlled. GOI controls the MRP of urea and has fixed it at INR 5,360 per MT.
Composition of the current MRP INR 5360 per MT (exclusive of the Central/State Taxes)
- INR 180/MT dealer margin for private and PSU sector and INR 200/MT margin for dealers in the cooperative sector and and Rs. 50/MT to retailers for acknowledging the receipt and reporting the stock in mFMS (iFMS) as additional incentive.
- An extra MRP of 5 % (of Rs. 5360/- per MT) is charged by fertilizer manufacturing entities on Neem Coated Urea.

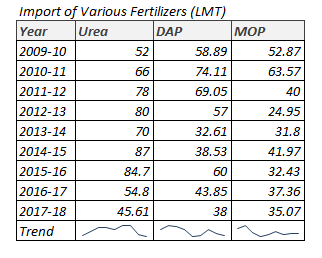
Urea production has grown at 2% from 2012-13 till 2016-17 in the country while imports have fallen 9% from 2012-13, the gradual increase in domestic urea production and subsequent fall in imports has made it clear that import substitution trend has picked up and can be achieved soon.
However, there are issues pertaining to the urea sector-
Issues of Urea Sector
1] Non-payment of increased fixed cost-
Indian urea industry continues to be compensated on cost data of 2002-03. This means, the increase in fixed cost for the last 15 years over the level of 2002-03 are not being reimbursed to the urea units under the pricing and subsidy policy.
2] Un-reasonable Reduction in Energy Consumption Norms –
Energy consumption norms have been reduced thrice after 2003 without recognizing the capital expenditure required for achieving such energy levels. The latest round of revision of energy consumption norms happened w.e.f. June 2015 under New Urea Policy (NUP) 2015. What is worse, the NUP 2015 proposed further reduction in energy consumption norms from 2018-19 without providing any window for recovery of the capex needed for achieving such energy levels. Major capital replacements are required to achieve proposed energy consumption norms which the industry cannot afford.
3] Issues of Coal Using Units –
Gas based urea units are using coal for power and steam generation. The cost of energy through coal is significantly lower compared to cost of energy through gas. But, energy efficiency of coal in terms of Gcal per tonne of urea is lower. Yet, the total cost of energy through coal is lower than the cost of energy through gas. Therefore, government has all along been encouraging use of coal. But, this aspect has been overlooked while fixing energy consumption norms under New Urea Policy 2015. Such drastic reduction in energy norms without any consideration for use of coal will severely impact the viability of these units.
4] Issue of Production Beyond 100% Reassessed Capacity –
New Urea Policy 2015 provides that production above 100% of reassessed capacity will be entitled for respective variable cost of the unit plus a uniform per tonne incentive equal to the lowest of per tonne fixed cost of all indigenous urea units subject to import parity price (IPP) plus weighted average of other incidental charges which the Government incurs on imported urea. But since the Government is yet to reimburse minimum fixed cost of Rs. 2300 per tonne of urea as provided in the Modified NPS-III policy, excess production continued to be reimbursed based on the minimum fixed cost of Rs.1285 per tonne. This is impacting the viability of additional production beyond re-assessed capacity.
DAP
DAP falls under the de controlled category of fertilizers and it has high nitrogen and phosphorous concentrations.

DAP production levels increased from 37.9 LMT to 43.3 LMT a growth of 14.4% from 2015-16 to 2016-17 as there was fall in raw material prices worldwide. The major raw materials for DAP are rock phosphate and phosphoric acid.

FAI Annual Report 2017-18
FAI Annual Report 2016-17
Fertilizer Report – July 2017
Link – http://www.careratings.com/upload/NewsFiles/SplAnalysis/Fertilizers%20Report%20-%20July%202017.pdf
Consumption and Imports of Fertilizers Over The Years


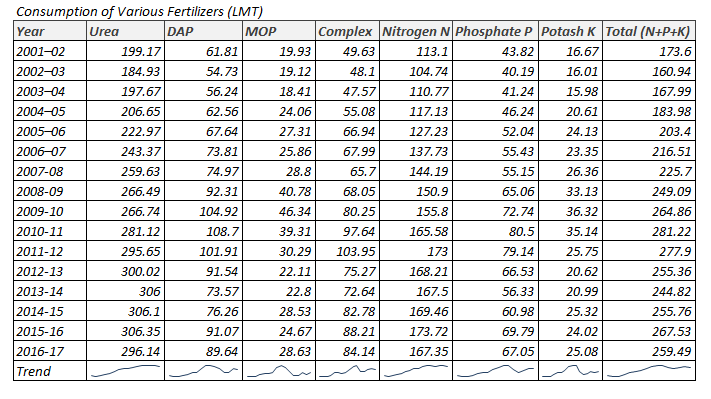
It is clearly evident that up until 2009-10, the production of DAP and MOP topped at 104.92 LMT and 46.34 LMT respectively, 2009-10 year saw the implementation of NBS scheme and it was decided that P and K based fertilizers would be partially de controlled and the prices would be decided by the market forces rather than the government fixing the MRP. Subsequently, with rise in input prices the prices of DAP and MOP rose which led farmers substituting or rather over substituting urea (controlled and cheap) with these P and K fertilizers, DAP and MOP.
Fertilizer Landscape
Government Initiatives & Subsidies
Fertilizer industry is highly regulated and monitored by GOI. In the annual budget of 2017-18, government allocated INR 70,000 cr for the fertilizer industry as subsidies. The difference between the cost of production which is higher than the price or MRP at which the fertilizer is sold is paid by the government in the form of subsidies.

Even though the budget allocation by GOI is the same, there has been a change in the allocation of the INR 70,000 cr of subsidy which signifies that GOI is encouraging the use of decontrolled fertilizer (fertilizer under the NBS scheme) over urea. Decontrolled fertilizer such as DAP, SSP, MOP etc have their prices decided by the market forces.
Grave Subsidy Scene
Only 35% of the 70,000 cr annual outlay in the form of subsidies reaches the Indian farmer. To plug the leakages, government drew up an ambitious plan based on the use of three databases – land owner ship record, soil heath card and Aadhar.
Since 1977, GOI has been providing fertilizer at an indiscriminate manner to the farmers, and excessive use of fertilizer has ended up degrading the soil health and polluting water.
Soil Health Card Scheme
In July of 2015, government launched a scheme to provide soil health cards. These cards were to contain information on soil nutrients and provide recommendations for the agricultural plot. When a farmer goes to the retailer, a POS at the shop would check this database and inform the retailer, how much fertilizer should be sold to the farmer for a particular crop?
But this new system did not entirely work well and government had to scale back its plan.
The Problem Of The Old System
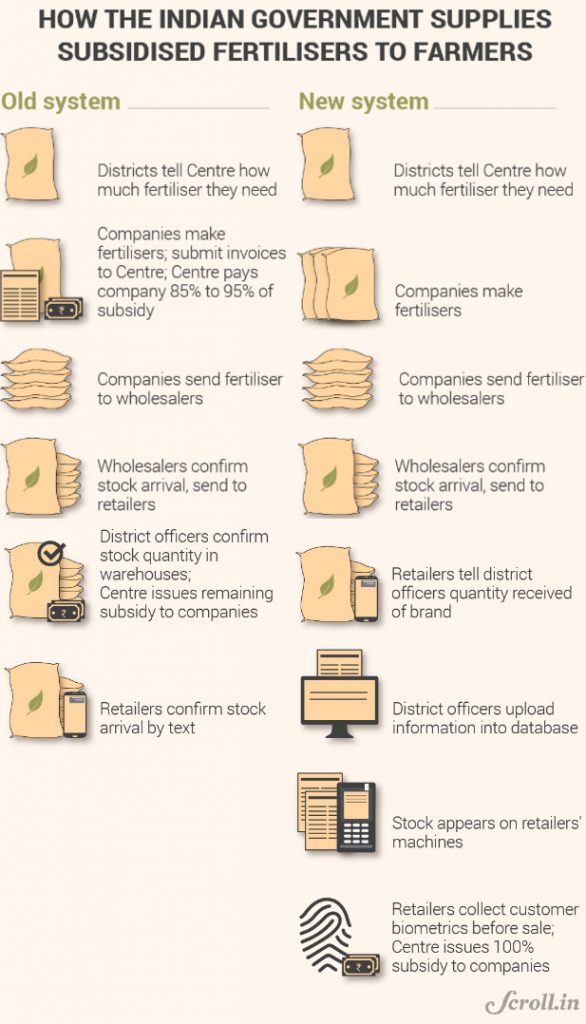
For years there has been a pilferage of fertilizer in the system. The subsidies are routed to the manufacturers of fertilizer (the companies). The government releases 85-90% of the subsidy amount once the manufacturers release the fertilizer to the district level warehouse. The system looks good on paper but the reality is different. The fertilizers get diverted to other Industries such as plywood and paint manufacturers that use similar chemicals in their manufacturing process. Fertilizers are also illegally exported to neighboring countries such as Nepal and Bangladesh where fertilizers are expensive.
Even the fertilizer companies complain of delays in release of subsidies by the Government, which forced them to borrow and pay hefty interest close to ~3,500 cr, corroding their profitability.
Reforming The Supply Chain
In 2007 GOI launched the fertilizer monitoring system which made it compulsory for manufacturers to upload data on the web of sales they made to the wholesalers. In 2012, government launched the fertilizer management system which brought the retailers into the fold and these retailers were supposed to confirm the fertilizer receipt from wholesalers.
GOI wanted market to dictate the fertilizer prices and then the government would release the subsidy payments directly into the accounts of the beneficiaries and not pay for the pilferage’s into neighboring countries.
But this plan to make cash payments directly into the accounts of the farmers was abandoned in 2013 because identifying beneficiary farmer was too complicated.
In 2014, post swearing in of PM Narendra Modi, the ambitious plan to make cash payments directly into the accounts of farmers was again pondered upon, it was decided to use the Aadhar Number to identify farmers and then pave the way for cash transfers in the future.

Aadhar Based Pilot Projects Launched – How It worked on the ground?
Pilot projects were launched in Krishna district of Andhra Pradesh, farmer visits the retailer, the retailer is provided with a POS which identifies the farmer using the farmers Aadhar Number, which is followed by land record verification to confirm that the buyer is actually a farmer. Third step is the intelligence step where in the POS suggests the fertilizers the farmer should buy based on the digital soil health card displayed on the POS for the individual farmer.
There were incidences where the machine instructed the retailer to sell for example 700 kgs of urea to which the farmers expressed disappointment, because they have been utilizing far bigger quantities of fertilizers in the past which has yielded them good produce and following the machines instruction and agreeing to such a low quantity of fertilizer germinates doubt in the minds of the farmers and they go with their wisdom and demand for bigger quantities.
The retailers were not in a position to deny the farmers as they feared agitation in the district and economic losses. Further the retailers are paid on per ton basis which incentivizes them to sell bigger quantities of fertilizers.
Composition of the current MRP INR 5360 per MT for urea
- INR 180/MT dealer margin for private and PSU sector and INR 200/MT margin for dealers in the cooperative sector.
- INR 180/MT is given as retailer margin which is an incentive provided to the retailer to acknowledge the receipt of the fertilizer.
What Government Did Next?
In October of 2016, the government delinked the fertilizer subsidy scheme from the two databases- land records and soil health cards. The intent was to ensure that genuine beneficiaries were not left out due to technical glitches in the POS which instructed strange quantities (often low) of fertilizers to the farmers.
This move also led to GOI not being able to identify whether the buyer is actually a farmer and this led to pilferage’s starting all over again.
Disclaimers :
The information herein is used as per the available sources of bseindia.com, company’s annual reports & other public database sources. Alpha Invesco is not responsible for any discrepancy in the above mentioned data. Investors should seek advice of their independent financial advisor prior to taking any investment decision based on this report or for any necessary explanation of its contents
Future estimates mentioned herein are personal opinions & views of the author. For queries / grievances – support@alphainvesco.com or call our support desk at 020-65108952.
SEBI registration No : INA000003106
Readers are responsible for all outcomes arising of buying / selling of particular scrip / scrips mentioned here in. This report indicates opinion of the author & is not a recommendation to buy or sell securities. Alpha Invesco & its representatives do not have any vested interest in above mentioned securities at the time of this publication, and none of its directors, associates have any positions / financial interest in the securities mentioned above.
Alpha Invesco, or it’s associates are not paid or compensated at any point of time, or in last 12 months by any way from the companies mentioned in the report.
Alpha Invesco & it’s representatives do not have more than 1% of the company’s total shareholding. Company ownership of the stock : No, Served as a director / employee of the mentioned companies in the report : No. Any material conflict of interest at the time of publishing the report : No.
The views expressed in this post accurately reflect the authors personal views about any and all of the subject securities or issuers; and no part of the compensations, if any was, is or will be, directly or indirectly, related to the specific recommendation or views expressed in the report.
Stay Updated With Our Market Insights.
Our Weekly Newsletter Keeps You Updated On Sectors & Stocks That Our Research Desk Is Currently Reading & Common Sense Approach That Works In Real Investment World.