Disclaimer: The Blog on ‘Financial Shenanigans’ is not a recommendation to buy / hold / sell any stock. The published post is for information purpose only. Please read the detailed disclaimer at the bottom of the post.
Financial Shenanigans – How A Management Can Mislead Its Investors About A Company’s Financial Performance Or Economic Health By Using Few Accounting / Financial Reporting Tricks – Part 5
Below article is follow up of the article – “Financial Shenanigans – How A Management Can Mislead Its Investors About A Company’s Financial Performance Or Economic Health By Using Few Accounting / Financial Reporting Tricks – Part 4”. You can read the previous parts of the article – Part 1 (Link), Part 2 (Link) & Part 3 (Link), Part 4 (Link)
In the previous set of articles, we have climbed the first two mountains in our quest to conquer financial shenanigans, with one big climb still to come. Until now, we have focused on assessing the performance of companies using two separate metrics: earnings and cash flow. However, our quest is not yet over. In this article we discuss the importance of using other “key metrics” to evaluate a company’s performance and economic health, and we expose tricks that companies could use to cloud the picture and mislead investors.
Two Key Metrics Shenanigans :
KM No.1 : Showcasing Misleading Metrics That Overstate Performance
KM No. 2 : Distorting Balance Sheet Metrics to Avoid Showing Deterioration
Let’s look at these Key Metrics Shenanigans in detail :
KM No 1. Showcasing Misleading Metrics That Overstate Performance :
1. Highlighting a Misleading Metric as a Surrogate for Revenue
Many people consider revenue growth to be an important and straightforward measure of the overall growth of a business. Companies also frequently provide additional data points to supplement revenue, providing investors with more insight into product demand and pricing power. As discussed in the previous chapter, investors should welcome this additional information and analyse these supplemental non-GAAP (generally accepted accounting principles) revenue metrics to better assess the sustainable business performance. However, sometimes these revenue surrogates provided by management can be misleading and can harm investors if they have not put appropriate safeguards in place.
Revenue growth at retailers and restaurants is often fueled by the opening of additional stores. Logically, companies that are in the middle of a rapid store expansion show tremendous revenue growth, since they have many more stores this year than they had the prior one. While total company revenue growth may give some perspective on a company’s size, it gives little information on whether the individual stores are performing well.
To provide investors with that insight, management often reports a metric called “same-store sales” (SSS) or “comparable-store sales.” This metric establishes a comparable base of stores (or “comp base” for short) for which to calculate revenue growth, allowing for more relevant analysis of true operating performance. However, because same-store sales fall outside of GAAP coverage, no universally accepted definition exists, and calculations may vary from company to company. Worse, a company’s own calculation of SSS in one quarter may differ from the one used in the previous period.
When a company experiences fairly consistent growth, same-store sales should be trending up consistently with the average revenue at each store. By comparing SSS with the change in revenue per store (i.e., total revenue divided by average total stores), investors can quickly spot positive or negative changes in the business. If suddenly after a consistent trend a divergence start appearing, it can indicate two of these problems: (1) the company’s new stores are beginning to struggle (driving down revenue per store, but not affecting SSS because they are not yet in the comp base), or (2) the company has changed its definition of same-store sales (which affects the SSS calculation but not total revenue per store).
Companies usually disclose how they define same-store sales. Once the definition is disclosed, investors should have little difficulty tracking it from period to period. Companies can manipulate same-store sales by adjusting the comp base in two possible ways. The first involves simply changing the length of time before a store enters the comp base (for example, requiring a store to be open for 18 months, versus 12 months previously). The second trick involves changing the types of stores included in the comp base (for example, excluding certain stores based on geography, size, businesses, remodelling, and so on).
The comp base can also be influenced by unrelated company activities, such as acquisitions. For example, from 2004 to 2006, the universe of stores in the comp base of Starbucks kept changing each quarter as the company continuously bought up its regional licensees and put them into the comp base. As a result, Starbucks calculated same-store sales using a slightly different universe each quarter—hardly a comparable metric. If Starbucks had been purchasing its strongest licensees, this acquisition activity would have had a positive impact on SSS performance, thereby misleading investors about the company’s underlying sales growth.
Starbucks’s 2006 same-store sales trend began diverging from its revenue per store trend. The gap widened in 2007, and in September 2007, Starbucks reported that U.S. traffic had fallen for the first time ever. When same-store sales in the United States turned negative in December, Starbucks announced that it would no longer disclose SSS, stating that it will “not be an effective indicator of the Company’s performance.”
Investors should sound the alarm if a key metric goes missing.
2. Highlighting a Misleading Metric as a Surrogate for Earnings
Consider Global Crossing, In March 2007, company reported a net loss of $120 million for the quarter. Desperate to show a profit, however, management removed expenses using a pro forma concoction reminiscent of its bad behaviour during the dot-com bubble. First, management removed $97 million in expenses for interest, taxes, depreciation, and some other items to get to a metric it called “adjusted EBITDA” (earnings before interest, taxes, depreciation, and amortization). Then, it removed $15 million in noncash stock compensation expense, bringing the company to an “adjusted cash EBITDA” of negative $8 million. Close, but not all the way to profitability, management then removed a host of charges that it deemed one-time in nature, propelling the company to a positive $4 million in what it called “adjusted cash EBITDA less one-time items.” Bull’s-eye!
It is easy to be skeptical about Global Crossing’s three levels of pro forma, and it is hard not to laugh when looking at some of the “one-time” charges that the company removed (see below table).
Last time we checked, expenses for “maintenance” are a normal cost of doing business and therefore should never be excluded from a pro forma calculation. Ditto for customer defaults (bad debts), employee retention bonuses, and routine regulatory charges. Do not be fooled into thinking that these items will not recur just because management decides to present them as one-time in nature.

That which companies call earnings, by any other name would smell as sweet . . . or so management would like you to think. Sometimes management insists that a foul-smelling “pro forma” or “adjusted” earnings metric (or any other earnings metric with a qualifying name) is a sweet and pure measure of earnings.
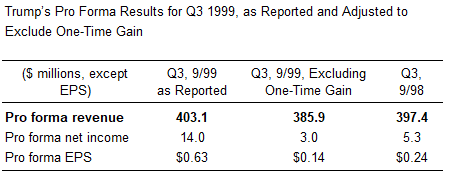
Well now consider this, In 1997, Trump Hotels & Casino Resort opened an All-Star Cafe in its Atlantic City Taj Mahal Casino in 1997. All Star Cafe signed a 20-year lease; however, just two years later, its parent company (Planet Hollywood) went bankrupt. As a result, the lease was terminated, and all of the sports memorabilia and real estate improvements in the All-Star Cafe became the property of Trump. Trump valued this property at $17 million and, in September 1999, recorded a one-time gain. (Shockingly, Trump put this gain in revenue!) When releasing its earnings results to Wall Street, however, Trump conveniently forgot to tell investors about this one-time benefit and failed to remove it from its pro forma numbers. As shown in table below, had Trump been more truthful in communicating with its investors and reported an honest measure of pro forma results, the company would have reported declines in both earnings and revenue, in contrast to the reported growth in both metrics.
3. Highlighting a Misleading Metric as a Surrogate for Cash Flow
Companies sometimes present metrics like “cash earnings” or “cash EBITDA” (as we just saw with Global Crossing). Do not confuse these metrics with substitutes for cash flow! Many companies and investors alike believe that these metrics (as well as plain old EBITDA) are good surrogates for cash flow simply because the calculation includes the adding back of noncash expenses such as depreciation. Ignoring working capital changes when calculating cash flow will provide you with a fictional portrait of a company’s cash-generation abilities, in the same way that ignoring accruals for expenses such as bad debts, impairments, and warranty expenses will give you an illusory sense of profitability. In reality, metrics such as EBITDA and cash earnings are poor representations of performance.
Moreover, for capital-intensive businesses, EBITDA is often an illusory measure of performance and profitability because all of the major capital costs run through the Statement of Income as depreciation, and therefore are excluded from EBITDA. Some companies abuse the investment community’s acceptance of EBITDA and use the metric even though it is completely unwarranted. For example, rent-to-own retailer Rent-A-Center, Inc., purchases inventory (such as furniture and home electronics) and then rents the merchandise to customers for a monthly fee. Rent-A-Center records the rental fees as revenue, and the rental merchandise is depreciated over the rental life and recorded as “cost of rentals” on the Statement of Income (similar to cost of goods sold). However, when presenting its EBITDA, the company excludes the impact of these costs because they can be considered depreciation. We find it completely inappropriate to exclude these costs from any legitimate measure of profitability, since they are indeed the cost of inventory.
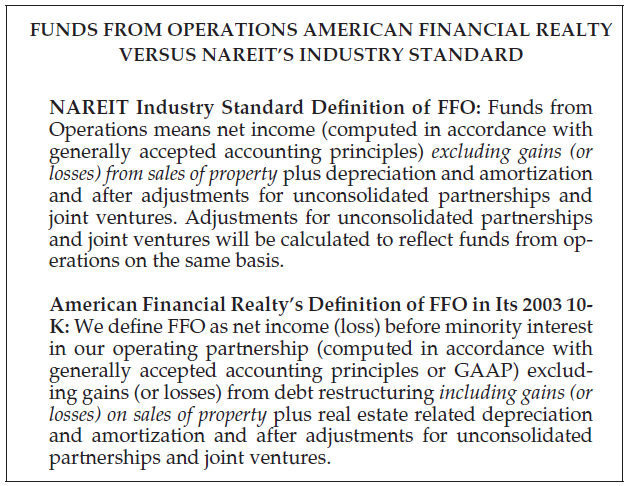
The real estate investment trust (REIT) industry uses the funds from operations (FFO) metric as a standard for measuring company performance. While this metric was not promulgated by GAAP, it is widely viewed as a gauge of a REIT’s ability to generate cash flow and is often viewed as being more useful than traditional GAAP earnings or cash flow measures. In order to promote the consistency and legitimacy of this performance metric, the industry’s main trade group, the National Association of Real Estate Investment Trusts (NAREIT), laid out a strict definition of FFO. NAREIT defined FFO to be net income excluding depreciation, gains or losses from the sale of property, and income from unconsolidated joint ventures.
Some companies, however, are not really interested in conforming to voluntary industry standards, especially when they benefit from going rogue. American Financial Realty, for example, shunned the industry standard definition in 2003 and instead used its own more favourable definition, which, of course, inflated performance and helped management reach its bonus targets. As shown in the accompanying box, the primary difference between American Financial Realty’s definition and the industry standard was that the company decided to include its gains from the sale of property, whereas NAREIT explicitly prohibits this. Had American Financial Realty excluded these gains from the calculation as dictated by the industry definition, the company’s 2003 FFO would have been cut by nearly half.
KM No. 2 : Distorting Balance Sheet Metrics to Avoid Showing Deterioration
1. Distorting Accounts Receivable Metrics to Hide Revenue Problems
Company managements are well aware that investors review working capital trends carefully to spot signs of poor earnings quality or operational deterioration. They realize that a surge in receivables that is out of line with sales will lead investors to question the sustainability of recent revenue growth. What easier way could there be to keep these questions at bay and give investors what they cherish (stable receivable growth) than by distorting the numbers? This first section deals with games to keep the reported accounts receivable lower by (1) selling them, (2) converting them into notes receivable, or (3) moving them somewhere else on the Balance Sheet.
In previous article while discussing “CF shenanigans no 1. Shifting Financing Cash Inflows to the Operating Section” we discussed how management can boost its CFFO from sale of receivables. Remember whenever you spot CFFO boost from the sale of receivables; also realize that by definition, the company’s DSO will have been lowered as well. (To calculate DSO on an apples-to-apples basis, simply add back sold receivables that remain outstanding at quarter-end for all periods)
UTStarcom pulled a similar switcheroo in 2004 by taking more payment in the form of “bank notes” and “commercial notes.” Since these notes’ receivable were not categorized as accounts receivable on the Balance Sheet (in fact, the bank notes were considered cash), UTStarcom was able to present a more palatable DSO to investors, despite a severe deterioration in its business. Diligent investors could easily have spotted this improper account classification by reading UTStarcom’s footnotes. As shown in the accompanying box, the company disclosed clearly that it had accepted a substantial amount of bank and commercial notes in place of accounts receivable.

Investors received another warning on UTStarcom’s Balance Sheet: notes receivable surged, from $11 million in December 2003 to $43 million the following quarter. By now, it should be abundantly clear that identifying the reason for such a change is extremely important. If management cannot provide you with a plausible reason, assume that it is playing a game with accounts receivable and trying to hide a bulging DSO. In the case of UTStarcom, you would have solved the mystery by simply reading the footnotes that disclosed that these notes receivable, effectively, had been transformed from accounts receivable.
For the purposes of identifying aggressive revenue recognition practices, we suggest that investors use the ending (not the average) receivables balance. Using average receivables works fine when investors are trying to assess cash-management trends, but it works less well when they are trying to detect financial shenanigans.
2. Distorting Inventory Metrics to Hide Profitability Problems
Investors typically view an unexpected rise in inventory as a sign of upcoming margin pressure (through markdowns or write-offs) or falling product demand. Some companies with inventory problems seek to avoid this negative perception by toying with their inventory metrics.
Companies will sometimes reclassify inventory to a different account on the Balance Sheet. Pharmaceutical giant Merck & Co., for example, in 2003 began reporting part of its inventory as a long-term asset, included in the “other assets” line on the Balance Sheet. A footnote revealed that these oddly classified inventories related to products that were not expected to be sold within one year. In December 2003, the long-term portion of Merck’s inventory represented 13 percent of the total, and the next year, it jumped to 25 percent. Investors should certainly have included these long-term inventory totals when analysing Merck’s inventory trends. A sudden spike in long-term inventory warrants concern by investors.
Investors should always be cautious about new company-created metrics. Inventory balances at mall retailer Tween Brands Inc. had been bulging in late 2006 and early 2007, and management correctly assumed that investors would be less than overjoyed. Specifically, days’ sales of inventory (DSI) jumped to 60 days in the May 2007 quarter from 52 days the preceding year, marking the third consecutive quarter of increase. Moreover, inventory per square foot (a non-GAAP metric often cited by Tween) increased by 18 percent. To address potential investor concerns about inventory, management began highlighting a new metric: “in-store” inventory per square foot. In May 2007, management tried to further assuage these concerns by claiming that the surge in inventory should not be a source of worry because “in-store” inventory had increased only a modest 8 percent ($27 per square foot versus $25 last year). Despite the irrationality of this statement, Wall Street bulls were pleased; all they needed was an explanation, no matter how absurd.
Tween’s explanation should have given astute investors pause on two grounds. First, it would be completely inappropriate for Tween to simply ignore inventory that it owned and included on its Balance Sheet, but that was not on store shelves. “Out-of-store” inventory qualifies as inventory and has no less markdown risk than “in-store” inventory. Second, and even more troublingly, Tween tricked investors by providing an “apples-to-oranges” comparison of its inventory growth. Specifically, the $25 cited by management as the prior year’s in-store inventory per square foot actually reflected total inventory per square foot, according to a 2007 report by Risk Metrics Group. By definition, comparing the current year’s in-store number with the prior year’s total number would understate inventory growth; off course it was up only 8 percent! Since the in-store metric was new, the prior year’s number was not previously disclosed, which made it difficult for investors to notice the inconsistency. However, diligent investors would have been skeptical enough about the creation of a new inventory metric at a time when inventory was increasing, and they would have tested its veracity and usefulness as a measure of company health.
3. Distorting Financial Asset Metrics to Hide Impairment Problems
Financial assets (such as loans, investments, and securities) are significant sources of income for banks and other financial institutions. Therefore, assessing the “quality” or strength of these assets should be a key part of understanding the future operating performance of such companies. For example, it is crucial for investors to understand whether a bank’s investment portfolio consists of risky, illiquid securities and to know if its loan portfolio is weighted toward dicey subprime borrowers.
Consider two banks that are identical in every way, except for the composition of their loan portfolios. One bank’s loan portfolio consists entirely of loans to subprime borrowers, 20 percent of which have failed to pay their bills on time. The other bank’s loan portfolio consists mainly of loans to prime borrowers, only 2 percent of which have failed to pay on time. It does not take a banking expert to realize that the second bank’s operating performance will be steadier, and that the first one may be in deep trouble.
Financial institutions will often present extremely helpful metrics that allow investors to understand the strength and performance of their assets. For example, a bank might report delinquency rates (as we did in the previous example), nonperforming loans, and loan loss reserve levels. However, sometimes management dresses up or conceals important metrics that would show a deterioration in order to present itself to investors in a more favourable light and to preserve the perception that the firm’s economic health is sound.
4. Distorting Debt Metrics to Hide Liquidity Problems
A company’s cash obligations, such as debt payments, may have an impact on future operating performance as well. Large near-term debt obligations may prevent a company from funding its desired growth initiatives or, at worst, send it spiraling toward bankruptcy.
In order to minimize the probability of loan defaults, many lenders lay out rules that require borrowers to maintain a certain level of economic health (called debt covenants). For example, lenders may require a borrower to maintain a certain level of sales, profitability, working capital, or book value. These covenants often pertain to non-GAAP measures of operating performance such as EBITDA (earnings before interest, taxes, depreciation, and amortization). Sometimes management’s motivation for fiddling with its numbers comes from the need to stay compliant with these debt covenants.
Investors should be alert to any shenanigans used by management that result in artificially meeting such covenants. Consider American Airlines’ bank credit facility, which required the company to maintain a minimum “EBITDAR to fixed charge coverage ratio.” (EBITDAR represented earnings before interest, taxes, depreciation, amortization, and rentals; and fixed charges generally included interest and total rentals.) In early 2003, American found itself in terrible financial condition and embarked on a significant restructuring plan to avoid bankruptcy. As a part of this plan, American’s lenders eased certain debt covenants, including this EBITDAR ratio.
Just one year later, however, American was struggling to maintain compliance with this covenant. According to reports from the Centre for Financial Research and Analysis at the time, several changes may have enabled the company to stay compliant in early 2004, including (1) a change in assumptions on revenue recognition for non-refundable tickets, (2) low reserving for expenses, and (3) a reclassification of leases. Alas, by September 2004, American ran out of fuel. The company announced that it was seeking to refinance this bank facility (at a higher cost) because it was no longer in compliance with its EBITDAR covenant.
With this we have completed not only the section on Key Metrics Shenanigans, but also the last of the three parts (Earnings Manipulation Shenanigans, Cash Flow Shenanigans & Key Metrics Shenanigans) of the Financial Shenanigans mosaic.
Disclaimers :
The information herein is used as per the available sources of bseindia.com, company’s annual reports & other public database sources. Alpha Invesco is not responsible for any discrepancy in the above mentioned data. Investors should seek advice of their independent financial advisor prior to taking any investment decision based on this report or for any necessary explanation of its contents
Future estimates mentioned herein are personal opinions & views of the author. For queries / grievances – support@alphainvesco.com or call our support desk at 020-65108952.
SEBI registration No : INA000003106
Readers are responsible for all outcomes arising of buying / selling of particular scrip / scrips mentioned here in. This report indicates opinion of the author & is not a recommendation to buy or sell securities. Alpha Invesco & its representatives do not have any vested interest in above mentioned securities at the time of this publication, and none of its directors, associates have any positions / financial interest in the securities mentioned above.
Alpha Invesco, or it’s associates are not paid or compensated at any point of time, or in last 12 months by any way from the companies mentioned in the report.
Alpha Invesco & it’s representatives do not have more than 1% of the company’s total shareholding. Company ownership of the stock : No, Served as a director / employee of the mentioned companies in the report : No. Any material conflict of interest at the time of publishing the report : No.
The views expressed in this post accurately reflect the authors personal views about any and all of the subject securities or issuers; and no part of the compensations, if any was, is or will be, directly or indirectly, related to the specific recommendation or views expressed in the report.
Stay Updated With Our Market Insights.
Our Weekly Newsletter Keeps You Updated On Sectors & Stocks That Our Research Desk Is Currently Reading & Common Sense Approach That Works In Real Investment World.