Central Government Spending as % of GDP
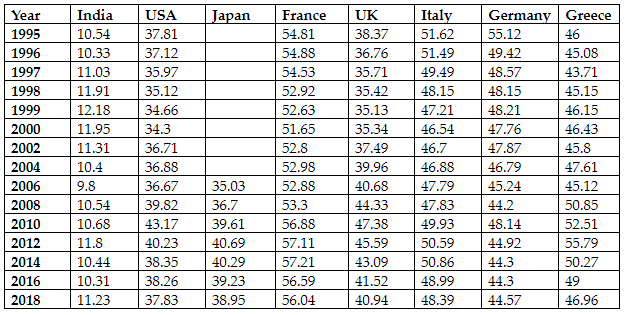
People, who think India is socialist, should study nations such as the USA, France, UK, Italy, Germany etc. These nations are part of the developed world and unlike the belief or the misconception that the government’s role in driving economic growth will be minimal in these nations, it is false.
India stands out as a true capitalist nation with lowest government spending as a percentage of GDP.
While the majority of these nations have witnessed lacklustre economic growth in the recent past India despite low government spending has led from the front.
Federal Government Debt & Pandemic of COVID 19
The pandemic of COVID 19 brought the globe to a standstill for a couple of months. Nations in the European continent where government spending is one of the highest should report the worst of GDP numbers for the coming quarters since Tax revenue collection will decline in these nations.
France’s government spending occupies 56% of the GDP and during COVID 19 it was in a standstill state. Revenue collection is going to take a hit. The only way out for France is to raise federal government debt and stimulate the economy.
Stock Market Index & COVID 19
Markets know these numbers and a lot of other data sets which I will miss. Despite weakening of the affairs of the federal government in the developed world, indices of respective nations are painting a different picture.
| Country | Index Name | COVID 19 Bottom Value | Value as of 18th May 2020 | Return % |
| USA | S&P 500 | 2,237.4 | 2,863.7 | 28% |
| Germany | DAX | 8,841.71 | 10,878.76 | 28.87% |
| France | CAC 40 | 3,754.84 | 4,428.27 | 18% |
| Italy | FTSE MIB | 14,980.34 | 17,036.92 | 13.73% |
| UK | FTSE 100 | 5,080.58 | 5,982.43 | 18% |
| Japan | TOPIX | 1,270.84 | 1,459.29 | 14.83% |
| India | SENSEX | 25,981.81 | 30,028.98 | 15.58% |
One probable reason for indices in these nations to have reacted positively could be stimulus spending by these nations, well that would demand a deeper investigation into each Nation’s stimulus announcement. Another reason that I can think of could be index composition which varies greatly. S&P 500 is technology heavy (24%), while SENSEX is financial services heavy (39%) and generally towards the end of bull cycle, large cap growth stocks tend to do well and technology falls in the camp of large cap growth while India has fewer growth companies in the large cap space.
Indian Government Debt
India’s Federal government too can load up debt and stimulate the economy and continue to stay a true capitalist nation.
Federal debt is also highest in these nations compared with that of India, yet India is worried about worsening macros and is being conservative. One possible reason could be that the Government of India does not want to interfere with the private economy and crowd out private sector borrowing.
| Country | Central Government Debt % of GDP |
| USA | 135.12 (2019) |
| Germany | 70.39 (2018) |
| France | 122.12 (2018) |
| Italy | 147.26 (2018) |
| UK | 116.56 (2018) |
| Japan | 238.73 (2018) |
| India | 67.7 (2019) |
Source – worldeconomy
While a smaller government in India may look depressing as of now, but a flip side of it can be that we may see positive green shoots when the private sector clampdowns are lifted and people’s life come back to normalcy and the bearish scenarios painted by market experts may turn out to be too harsh and economy may surprise positively.
Disclaimers :
The information herein is used as per the available sources of bseindia.com, company’s annual reports & other public database sources. Alpha Invesco is not responsible for any discrepancy in the above mentioned data. Investors should seek advice of their independent financial advisor prior to taking any investment decision based on this report or for any necessary explanation of its contents
Future estimates mentioned herein are personal opinions & views of the author. For queries / grievances – support@alphainvesco.com or call our support desk at 020-65108952.
SEBI registration No : INA000003106
Readers are responsible for all outcomes arising of buying / selling of particular scrip / scrips mentioned here in. This report indicates opinion of the author & is not a recommendation to buy or sell securities. Alpha Invesco & its representatives do not have any vested interest in above mentioned securities at the time of this publication, and none of its directors, associates have any positions / financial interest in the securities mentioned above.
Alpha Invesco, or it’s associates are not paid or compensated at any point of time, or in last 12 months by any way from the companies mentioned in the report.
Alpha Invesco & it’s representatives do not have more than 1% of the company’s total shareholding. Company ownership of the stock : No, Served as a director / employee of the mentioned companies in the report : No. Any material conflict of interest at the time of publishing the report : No.
The views expressed in this post accurately reflect the authors personal views about any and all of the subject securities or issuers; and no part of the compensations, if any was, is or will be, directly or indirectly, related to the specific recommendation or views expressed in the report.
Stay Updated With Our Market Insights.
Our Weekly Newsletter Keeps You Updated On Sectors & Stocks That Our Research Desk Is Currently Reading & Common Sense Approach That Works In Real Investment World.