Disclaimer: This post on the Indian Banking Sector is not a recommendation to buy / hold / sell any securities or any bank mentioned in the blog post. The published post is for information purpose only. The intention to share write ups on this blog is to create a repository of ideas so that investors can have a look at various frameworks & approaches. Please read the detailed disclaimer at the bottom of the post.
Continuing our study on Banks we have come up with part 2 of the series where we will understand various line items in a banks financial statement. We have defined and discussed definitions like wholesale deposits, shareholders equity, interchange fee on POS transaction (debit & credit card) etc. We have also discussed various risks like market risk, interest rate risk, forex risk etc faced by banks.
To read part 1 of the series please Click Here.
Depositors & Borrowers
The depositors and borrowers can be segmented into Retail and Corporate customers. Retail customers are individual consumers, whereas corporate customers can be segmented to small companies, mid-size enterprises, and large corporate.
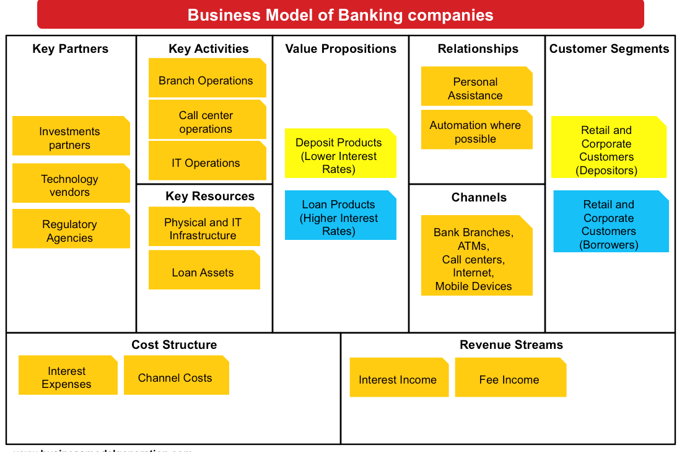
Banks offer different value propositions to different customer segments.
To retail customers, banks offer Home loans, Education loans, Auto loans, and Personal loans. And for Corporate customers in different industries have different loan requirements. For example, Power sector companies need money to fund power projects. Airline companies need money to purchase airplanes. Construction companies need money for building projects.
Before offering them money in form of loans, one critical exercise that banks do is the risk assessment. This is to ensure that they will get back the money, along with the interest, they are lending.
Banks have two key revenue streams. First is the interest income from lenders. Second is the fee that they charge for different kinds of operations. Banks also make money through Credit cards business. Channel costs are the key component of the cost structure of a bank. The interest paid by the bank to the depositors is also one of the important cost structure components.
How Banks Make Money?
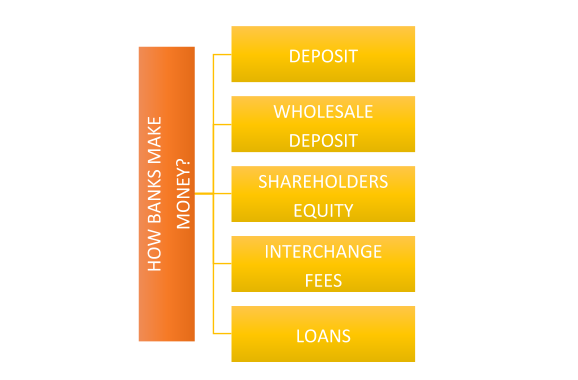
Deposit –
The largest source by far of funds for banks is deposits money that account holders entrust to the bank for safekeeping and use in future transactions, as well as modest amounts of interest. Generally referred to as “core deposits,” these are typically the checking and savings accounts that so many people currently have. In most cases, these deposits have very short terms.
While people will typically maintain accounts for years at a time with a particular bank, the customer reserves the right to withdraw the full amount at any time. Customers have the option to withdraw money upon demand and the balances are fully insured.
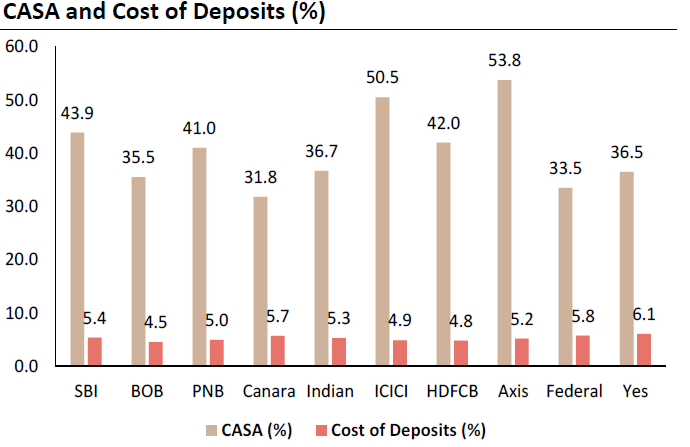
Many banks pay no interest at all on checking account balances, or at least pay very little, and pay minimal interest rates for savings accounts. By lending on high rates to borrower’s banks make money through deposits. Eg. This graph represents CASA% and cost of deposit % for the year 2018 for all the banks.
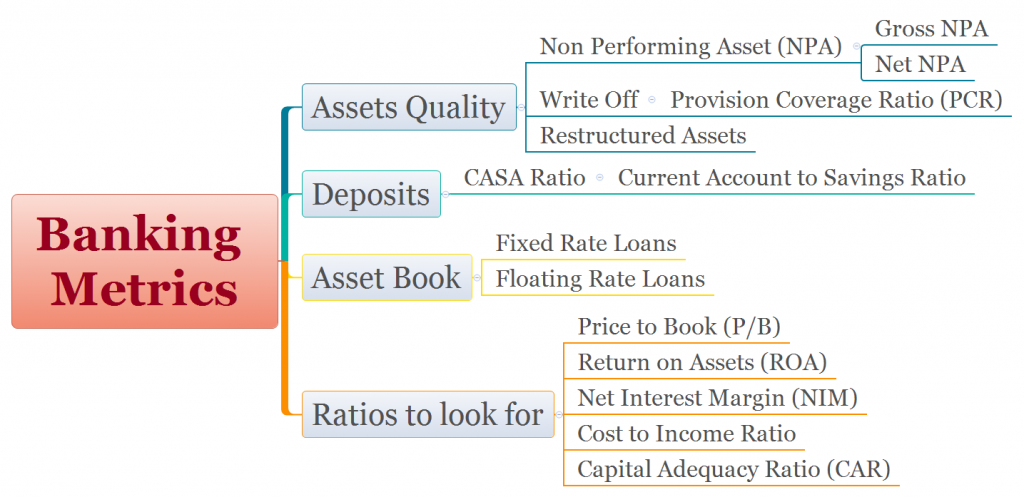
Key Metrics That Can Be Used To Track Banking Companies
Net Interest Margin
We should look for high net interest margin. If not high already, there should be an increasing trend.
Net interest margin is a parameter that is of great interest to a bank stock investor. It is the net interest income divided by the interest earning assets.
NIM tells you about the profitability of the core lending business of the bank. It is evident that the higher the proportion of CASA deposits in the total deposits, the lower will be the interest expense. A bank can choose to lend at attractive rates (lower than competitors) and still maintain a healthy NIM if its interest expenses paid to depositors are low.
Bank can contain the risk through innovative structuring or by taking adequate security, they can take this business which others have rejected. They can earn a high interest rate on loans which others are not in a position to make. This will give them a relatively high NIM even with roughly the same cost of funding as other banks.
Spread Is A Slightly Different Way To Look At The Interest Numbers.
Divide interest income by interest earning assets
Divide interest expense by interest bearing liabilities
The difference between the two figures is the interest spread.
Increasing Loan Growth
Loan growth means more interest income but might not mean more net interest income. This is because a bank needs to garner enough deposits at a reasonable cost to back the loan growth. There are some banks which grow their deposits with wholesale deposits instead of lower cost current account, saving account deposits (CASA).
Analysts also look at credit to deposit ratios. In a nutshell, credit deposit ratios tell you whether credit / loan growth is sustainable. For a bank to make incremental loans, it also has to grow deposits.
Decreasing Cost To Income Ratio
As operations become more efficient or loans outstanding per branch increase, operational costs decrease relative to income. Recall the profit and loss statement of a bank. Operational costs are deducted from net interest margin plus fee income.
Decreasing Non Performing Assets
We can track non-performing assets on an absolute basis in Rs. cr or in percentage form (NPAs divided by advances) respectively.
Decreasing NPAs on absolute basis are always good to see. Gross NPAs less provisions give you net NPAs. It is not a good sign if net NPAs stay relatively static and gross NPAs increase. This implies higher provisions which reduce profit after tax.
In the short run, one might be misled by NPAs on a percentage basis because NPAs can stay the same or even grow on an absolute basis while advances may grow relatively more, yielding a lower percentage NPA number.
Loan To Deposit Ratio
The loan/deposit ratio helps assess a bank’s liquidity, and by extension, the aggressiveness of the bank’s management. If the loan/deposit ratio is too high, the bank could be vulnerable to any sudden adverse changes in its deposit base. Conversely, if the loan/deposit ratio is too low, the bank is holding on to unproductive capital and earning less than it should.
Fee Income To Operating Income
Features like multi-branch banking, internet banking, and credit cards were not as widely used as they are today. Banks have more interactions with customers across multiple banking product lines and services that enable them to earn more in the form of fees. This is a parameter that many analysts track since fee income has been seen to grow at a fast clip in most banks as compared to the “traditional” net interest income.
Operating Expenses And Cost To Income
The biggest operating expense is usually salaries to employees. Other big expense heads are Rent, taxes and lighting , repairs etc. The cost to income ratio is the ratio of operating expenses to the net operating income As an investor, you want the cost to income ratio to be declining over time. This would signal efficiency in operations. It means that the banks is spending less on operations relatively to do more business (lending + fee income).
Provisions
Provisions are mandatory as per RBI guidelines. They force the bank to keep aside some of their income even if all is good (provisions on standard assets). They also force the bank to recognize bad loans and deduct appropriate amounts when there are signs that loans are going bad or have gone bad (provisions on substandard assets and NPAs). The better the credit process, the better will be the quality of the loan book. In bad times, lesser loans will go bad. Correspondingly, lesser provisions will need to be deducted from income.
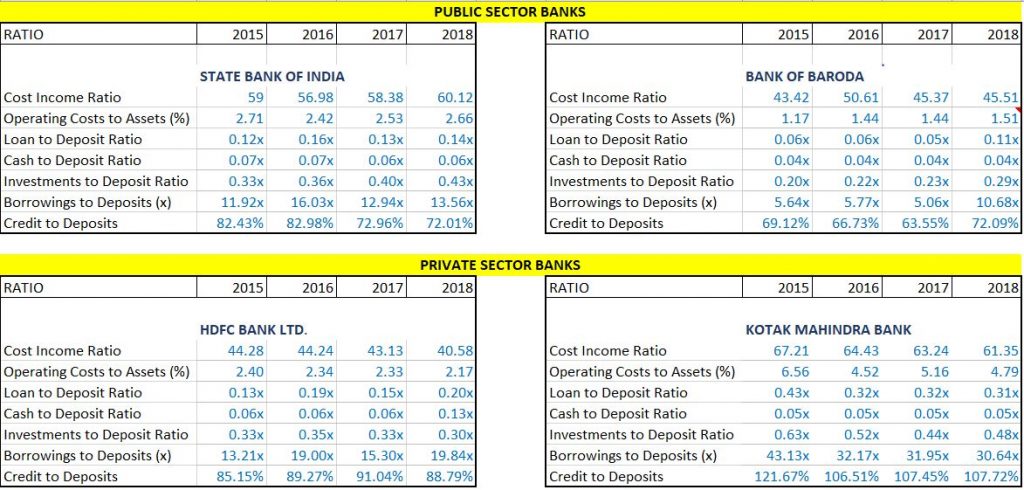
Let See Where a PSU Bank Stand Against A Pvt Bank –
Wholesale Deposits –
If a bank cannot attract a sufficient level of core deposits, that bank can turn to wholesale sources of funds. In many respects these wholesale funds are much like interbank CDs. There is nothing necessarily wrong with wholesale funds, but investors should consider what it says about a bank when it relies on this funding source.
While some banks de-emphasize the branch-based deposit-gathering model, in favor of wholesale funding, heavy reliance on this source of capital can be a warning that a bank is not as competitive as its peers.
Investors should also note that the higher cost of wholesale funding means that a bank either has to settle for a narrower interest spread, and lower profits, or pursue higher yields from its lending and investing, which usually means taking on greater risk.
Shareholders Equity –
While deposits are the primary source of loanable funds for almost every bank, shareholder equity is an important part of a bank’s capital. Several important regulatory ratios are based upon the amount of shareholder capital a bank has and shareholder capital is, in many cases, the only capital that a bank knows will not disappear.
Common equity is straight forward. This is capital that the bank has raised by selling shares to outside investors. While banks, especially larger banks, do often pay dividends on their common shares, there is no requirement for them to do so. Banks often issue preferred shares to raise capital. As this capital is expensive, and generally issued only in times of trouble, or to facilitate an acquisition, banks will often make these shares callable.
This gives the bank the right to buy back the shares at a time when the capital position is stronger, and the bank no longer needs such expensive capital. Equity capital is expensive, therefore, banks generally only issue shares when they need to raise funds for an acquisition, or when they need to repair their capital position, typically after a period of elevated bad loans.
Apart from the initial capital raised to fund a new bank, banks do not typically issue equity in order to fund loans.
Interchange Fee –
Interchange is the money banks make from processing credit and debit transactions. Each time you swipe your card at a store, the store, or merchant, pays an interchange fee. The majority of money from interchange goes to your bank–the consumer’s bank–and a little goes to the merchant’s bank. Because merchants have no control over interchange fees, there’s been some recent legislation that’s capped interchange fees on debit cards. Ever wonder how banks can afford to offer incentives and rewards for using their credit cards? Interchange! Merchants are assessed a higher interchange fee when reward program credit cards are used to make purchases. Additionally, banks cover the cost by charging membership fees.
Loans –
For most banks, loans are the primary use of their funds and the principal way in which they earn income. Loans are typically made for fixed terms, at fixed rates and are typically secured with real property often the property that the loan is going to be used to purchase.
Part and parcel of a bank’s lending practices is its evaluation of the credit worthiness of a potential borrower and the ability to charge different rates of interest, based upon that evaluation. When considering a loan, banks will often evaluate the income, assets and debt of the prospective borrower, as well as the credit history of the borrower.
What Types Of Risk Bank Has To Face?
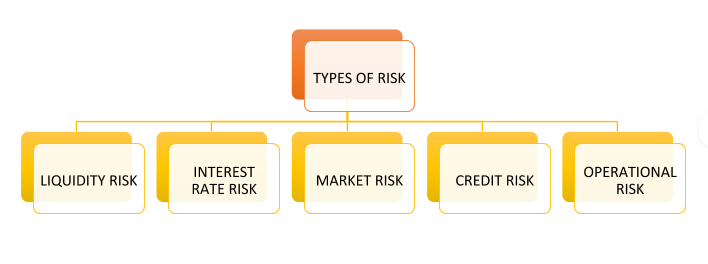
Bank usually faces five types of risk
Liquidity Risk
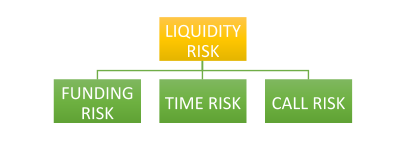
The liquidity risk of banks arises from funding of long-term assets by short-term liabilities, thereby making the liabilities subject to rollover or refinancing risk.
Funding Risk
Funding Liquidity Risk is defined as the inability to obtain funds to meet cash flow obligations. For banks, funding liquidity risk is crucial. This arises from the need to replace net outflows due to unanticipated withdrawal/ non-renewal of deposits (wholesale and retail)
Time Risk
Time risk arises from the need to compensate for nonreceipt of expected inflows of funds i.e., performing assets turning into non-performing assets.
Call Risk
Call risk arises due to crystallisation of contingent liabilities. It may also arise when a bank may not be able to undertake profitable business opportunities when it arises.
Interest Rate Risk

Interest Rate Risk arises when the Net Interest Margin or the Market Value of Equity (MVE) of an institution is affected due to changes in the interest rates. In other words, the risk of an adverse impact on Net Interest Income (NII) due to variations of interest rate may be called Interest Rate Risk. It is the exposure of a Bank’s financial condition to adverse movements in interest rates. IRR can be viewed in two ways – its impact is on the earnings of the bank or its impact on the economic value of the bank’s assets, liabilities and Off-Balance Sheet (OBS) positions. Interest rate Risk can take different forms.
Gap or Mismatch Risk –
A gap or mismatch risk arises from holding assets and liabilities and Off-Balance Sheet items with different principal amounts, maturity dates or re-pricing dates, thereby creating exposure to unexpected changes in the level of market interest rates.
Yield Curve Risk –
Banks, in a floating interest scenario, may price their assets and liabilities based on different benchmarks, i.e., treasury bills’ yields, fixed deposit rates, call market rates, MIBOR etc. In case the banks use two different instruments maturing at different time horizon for pricing their assets and liabilities then any non-parallel movements in the yield curves, which is rather frequent, would affect the NII. Thus, banks should evaluate the movement in yield curves and the impact of that on the portfolio values and income.
Basis Risk –
Basis Risk is the risk that arises when the interest rate of different assets, liabilities and off-balance sheet items may change in different magnitude. For example, in a rising interest rate scenario, asset interest rate may rise in different magnitude than the interest rate on corresponding liability, thereby creating variation in net interest income.
Embedded Option Risk –
Significant changes in market interest rates create the source of risk to banks’ profitability by encouraging prepayment of cash credit/demand loans, term loans and exercise of call/put options on bonds/ debentures and/ or premature withdrawal of term deposits before their stated maturities. The embedded option risk is experienced in volatile situations and is becoming a reality in India.
Net Interest Position Risk –
Net Interest Position Risk arises when the market interest rates adjust downwards and where banks have more earning assets than paying liabilities. Such banks will experience a reduction in NII as the market interest rate declines and the NII increases when interest rate rises.
Market Risk

The risk of adverse deviations of the mark-to-market value of the trading portfolio, due to market movements, during the period required to liquidate the transactions is termed as Market Risk. This risk results from adverse movements in the level or volatility of the market prices of interest rate instruments, equities, commodities, and currencies. It is also referred to as Price Risk.
Forex Risk
Forex risk is the risk that a bank may suffer losses as a result of adverse exchange rate movements during a period in which it has an open position either spot or forward, or a combination of the two, in an individual foreign currency.
Market Liquidity Risk –
Market liquidity risk arises when a bank is unable to conclude a large transaction in a particular instrument near the current market price.
Default or Credit Risk
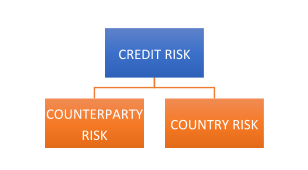
Credit risk is more simply defined as the potential of a bank borrower or counterparty to fail to meet its obligations in accordance with the agreed terms. In other words, credit risk can be defined as the risk that the interest or principal or both will not be paid as promised and is estimated by observing the proportion of assets that are below standard. Credit risk is borne by all lenders and will lead to serious problems, if excessive. For most banks, loans are the largest and most obvious source of credit risk. It is the most significant risk, more so in the Indian scenario where the NPA level of the banking system is significantly high.
Counterparty Risk
This is a variant of Credit risk and is related to non-performance of the trading partners due to counterparty’s refusal and or inability to perform. The counterparty risk is generally viewed as a transient financial risk associated with trading rather than standard credit risk.
Country Risk –
This is also a type of credit risk where non-performance of a borrower or counterparty arises due to constraints or restrictions imposed by a country. Here, the reason of non-performance is external factors on which the borrower or the counterparty has no control.
Operational Risk
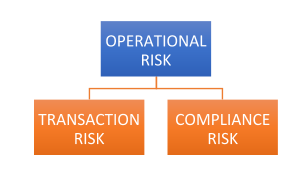
Basel Committee for Banking Supervision has defined operational risk as ‘the risk of loss resulting from inadequate or failed internal processes, people and systems or from external events’. Thus, operational loss has mainly three exposure classes namely people, processes and systems.
Managing operational risk has become important for banks due to the following reasons
1. Higher level of automation in rendering banking and financial services
2. Increase in global financial inter-linkages
Transaction Risk
Transaction risk is the risk arising from fraud, both internal and external, failed business processes and the inability to maintain business continuity and manage information. Compliance Risk Compliance risk is the risk of legal or regulatory sanction, financial loss or reputation loss that a bank may suffer as a result of its failure to comply with any or all of the applicable laws, regulations, codes of conduct and standards of good practice. It is also called integrity risk since a bank’s reputation is closely linked to its adherence to principles of integrity and fair dealing.
How Banks Make Money Through Credit Cards?
To understand how credit cards works, which customer segments it serves, what it offers to its customer segments, and how does it makes money from them, we need to get familiar with few terms. Credit cards classifies the banks as either Issuers or Acquirers. Issuers issue cards to the cardholders, whereas the Acquirers manage the relationship with the merchants.
The diagram below explains what happens behind-the-scenes when a cardholder presents a card for payment to a merchant.
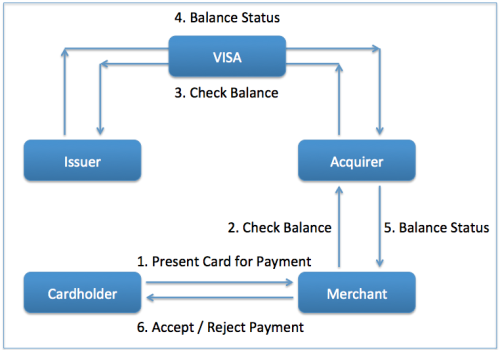
When a cardholder presents a card for payment to a merchant, the payment request is forwarded to the acquirer. The acquirer contacts the issuer through the VISA network. The issuer shares the information on whether sufficient balance is available to carry out the transaction. The information is then routed to the merchant. In case sufficient balance is available, the payment is accepted. Else, it is rejected. The issuer bills the cardholder on a monthly basis. The cardholder pays those bills then.
What Is Ignored In Diagram Is Explained Below In Detail
What the above diagram does not tell is how VISA and banks make money in the process. They make money from the transaction fees charged to merchants. To understand how it works, imagine a $100 payment from a cardholder to merchant. In case the merchant fee is 2.4%, the merchant would get $97.60 from the transaction. $2.40 would get unevenly split between issuer and acquirer, depending upon the interchange fee. In case of an interchange rate of 1.8%, the issuer will keep $1.80 and acquirer will keep $0.60. Issuer gets to keep more of the merchant fee because of a higher risk of payment default from the cardholder.
VISA makes money on payment volumes, transaction processing, and value-added services.
How Individual Makes Money Out Of This Process Is Explained Below
VISA creates value for all its stakeholders during the process. Cardholders’ benefit because of convenience, security, and rewards associated with card payments.
Merchants benefit from improved sales by offering payment method options to the customers. Banks get new revenue streams through card fees, late payment interests, and transaction fee cuts.
Please refer to the diagram below.
Diagram explaining the business model for banking companies.
How To Measure The Stability, Performance And Risk Of A Bank?
Banks can be rated according to a CAMELS system that ranks performance in six general categories. The letters refer to each rating category as:
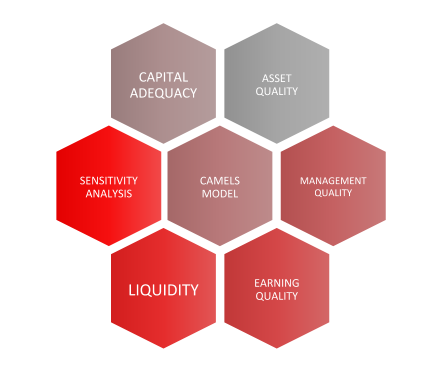
Capital Adequacy (Soundness) –
A bank should have sufficient capital to provide a stable resource to absorb any losses arising from the risks in its business. Capital is divided into tiers (Tier I and Tier II) according to the characteristics/qualities of each qualifying instrument. These categories represent different instruments’ quality as capital. Tier I capital consists mainly of share capital and disclosed reserves and it is a bank’s highest quality capital because it is fully available to cover losses. Tier II capital on the other hand consists of certain reserves and certain types of subordinated debt. The loss absorption capacity of Tier II capital is lower than that of Tier I capital. When returns of the investors of the capital issues are counter guaranteed by the bank, such investments will not be considered as Tier I/II regulatory capital for the purpose of capital adequacy. Tier II assets cannot be more than Tier I assets in bank’s capital structure according to RBI guidelines.
Asset Quality (Asset Quality) –
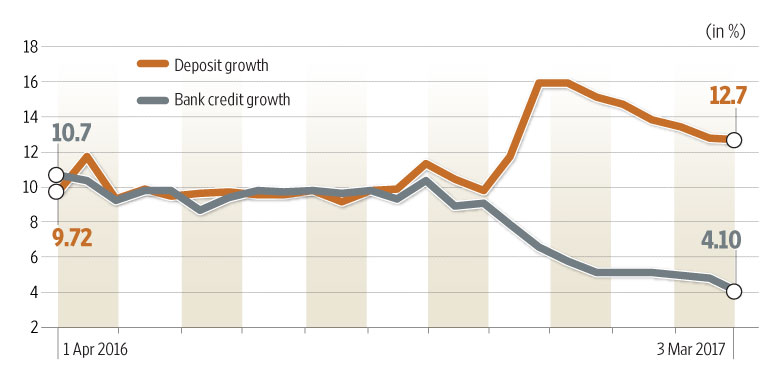
Deteriorating asset quality and low profitability is hurting Indian banks. Credit, sectoral, and geographic concentration is important to look at. Quality, concentration, and Resolution Structure (Legal/regulatory framework and term-sheet) is important. The quality of a bank’s asset depends on the credit profile of the borrower, the quality of collateral (if applicable) pledged, and the restructuring and resolution mechanism available in the country. Also, a well diversified bank asset book geographically, sectorally, and credit-wise – mitigates the risk concentration on bank. Currently Indian Banks are facing tough times with mounting NPAs and unfavourable business conditions. The deposit and credit growth both are in declining mode.
Deposit And Credit Growth For Indian Banks
A primary measure to calculate the quality of assets is to determine the proportion of RWA (risk weighted asset) of Total Assets.
RWA Density = RWA / *TA
* TA includes credit equivalent of off-balance sheet assets; Lower the ratio higher is the quality of assets.
Net Non-Performing Advances/Total Net Advances
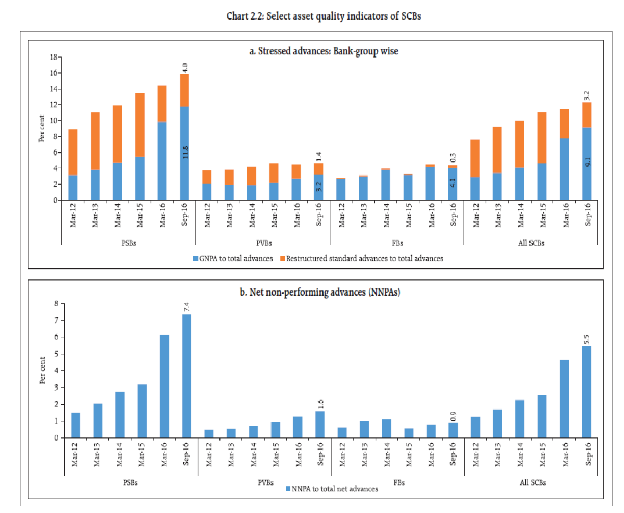
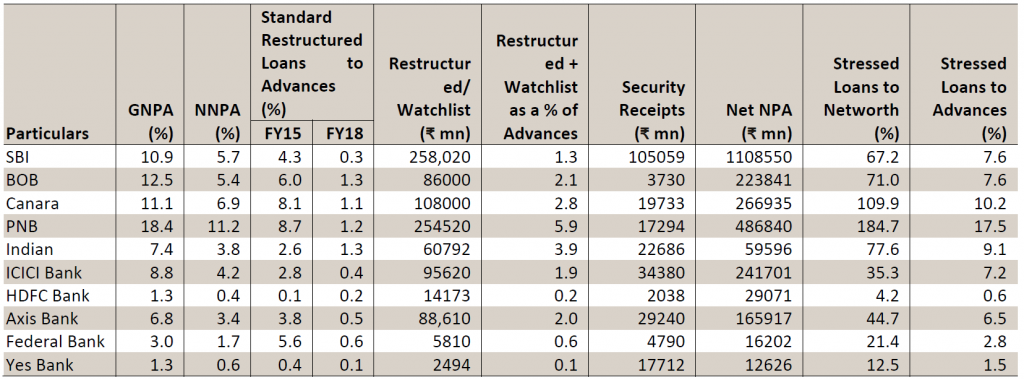
The average standard restructured loans of our PSU banking universe as a % of advances has declined from 5.9% in FY15 to 1% in FY18 and that of private banks in our coverage has moved from 2.5% to 0.4% during the same period, which gives a clear picture of slippages having peaked out. From the below data on security receipts we can see that of all PSU banks, BOB has the lowest net SRs at ₹ 3.73bn, in comparison to size of its corporate book. This is because it mostly prefers making sale of bad assets to ARCs on cash basis, in order to reduce the risks associated with non-recovery of NPAs by the ARC and resultant non-redemption of SR.
Management Quality (Efficiency And Efficacy) –
The expertise, experience, and, capability of the management. Ability to frame risk and policy governance structures and ensure its compliance.
This is critical in bank analysis as all else equal the management makes tremendous difference in bank stability, sustainability, and profitability by taking timely decisions for winding-up, expansion, and streamlining the business.
Earnings Quality (Profitability) –
A bank’s/Financial Institution’s income profile can broadly be divided into two categories: interest income and non-interest income. Interest income is generated by lending funds while fee based income (guarantee commission, loan processing fees, dividend income) and gains from trading/sale of assets form a part of non-interest income. The biggest expense for any bank/financial institution is the interest expended on deposits and borrowings. Operating expenses of a bank/FI primarily comprise employee cost and administration expenses. Other major charges to the profit and loss account include provision for non-performing assets and provision for diminution in fair value of investments.
Thus, earnings, earnings quality, and its sustainability for a bank depend upon:
- Cost of funding
- Efficiency of the business operations
- Market opportunity (macroeconomic and demographic conditions, growth, and profit margins)
Liquidity –
RBI requires every bank to have sound process for identifying, measuring, monitoring, and mitigating liquidity risk. The liquidity standards to be maintained are:
1. Interbank Liability Limit
2. Call Money Borrowing Limit
3. Call Money Lending Limit
The liquidity coverage ratio is an important part of the Basel Accord, defining how the value of liquid assets that are required to be held by financial institutions. The idea is that by requiring banks to hold a certain level of highly liquid assets, they are less able to lend high levels of short-term debt.
High-Quality Liquid Assets for the Liquidity Coverage Ratio
The high-quality liquid assets include only those with a high potential to be converted easily and quickly into cash. There are three categories of high-quality liquidity assets with decreasing levels of quality: level 1, level 2A and level 2B assets.
Under Basel III, level 1 assets are not discounted when calculating the LCR, while level 2A and level 2B assets have a 15% and 50% discount, respectively.
Level 1 assets include Federal Reserve bank balances, foreign resources that can be withdrawn quickly, securities issued or guaranteed by specific sovereign entities, and government issued or guaranteed securities.
Level 2A assets include securities issued or guaranteed by specific multilateral development banks or sovereign entities, and securities issued by government-sponsored enterprises.
Level 2B assets include publicly traded common stock and investment-grade corporate debt securities issued by non-financial sector corporations.
Liquidity Coverage Ratio (LCR) – The LCR refers to the proportion of High Quality Liquid Assets (HQLA) to provide at least 100% coverage to the projected cash outflow over a period of 30 days. HQLA are assets that are easily converted to cash even under stress situations.
Sensitivity Analysis And Stress Testing – Stress testing and sensitivity analysis are the risk management tools for a bank to evaluate the potential impact of an event or movement in a risk factor on firm’s assets quality, profitability, sustainability, or other financial variables. Stress testing of funding liquidity and operational risk is common in banking sector today along with loan book stress testing.
Stress testing is needed for:
• Capturing the impact of exceptional but plausible large-loss events on a portfolio.
• Checking if the capital buffer is sufficient under stress conditions.
• Introducing forward-looking elements in the capital assessment process reducing reliance on model parameters e.g. when historical correlation may no longer be valid.
• Ascertaining changes in the business environment, e.g. in liquidity.
• Reviewing changed horizons and liquidity of instruments.
• Supporting portfolio allocation decisions beyond the range of normal business conditions.
• Identifying hidden correlations within portfolios.
• Assessing the tail events beyond the level of confidence assumed in a given statistical model because, under stress conditions, the following may occur – Less predictability in the behaviour of stress factors. Rapid price movements and contagion may impact other markets. Shocks may spread across multiple markets. Economic conditions in affected regions may suddenly deteriorate.
Disclaimers :
The information herein is used as per the available sources of bseindia.com, company’s annual reports & other public database sources. Alpha Invesco is not responsible for any discrepancy in the above mentioned data. Investors should seek advice of their independent financial advisor prior to taking any investment decision based on this report or for any necessary explanation of its contents
Future estimates mentioned herein are personal opinions & views of the author. For queries / grievances – support@alphainvesco.com or call our support desk at 020-65108952.
SEBI registration No : INA000003106
Readers are responsible for all outcomes arising of buying / selling of particular scrip / scrips mentioned here in. This report indicates opinion of the author & is not a recommendation to buy or sell securities. Alpha Invesco & its representatives do not have any vested interest in above mentioned securities at the time of this publication, and none of its directors, associates have any positions / financial interest in the securities mentioned above.
Alpha Invesco, or it’s associates are not paid or compensated at any point of time, or in last 12 months by any way from the companies mentioned in the report.
Alpha Invesco & it’s representatives do not have more than 1% of the company’s total shareholding. Company ownership of the stock : No, Served as a director / employee of the mentioned companies in the report : No. Any material conflict of interest at the time of publishing the report : No.
The views expressed in this post accurately reflect the authors personal views about any and all of the subject securities or issuers; and no part of the compensations, if any was, is or will be, directly or indirectly, related to the specific recommendation or views expressed in the report.
Stay Updated With Our Market Insights.
Our Weekly Newsletter Keeps You Updated On Sectors & Stocks That Our Research Desk Is Currently Reading & Common Sense Approach That Works In Real Investment World.