Disclaimer: The Blog on Indian Banking Sector is not a recommendation to buy / hold / sell any stock. The published post is for information purpose only. The intention to share write ups on this blog is to create a repository of ideas so that investors can have a look at various frameworks & approaches. Please read the detailed disclaimer at the bottom of the post.
Indian Banking Sector – Some Uncommon Figures & Ratios
This blog is in continuation to our blog series on Banking sector, where we have tried to explain the Banking sector as whole from scratch (explaining the terms and jargons) and have deep dived into how Indian Banking sector has evolved over decades. In the current blog we focus on the ‘not-so-trivial’ data points of banks, which are commonly not looked at, but are worth looking at!
Note: All the data is as of 31st March 2018 / FY 18, unless specified.
Fee Income Of A Bank
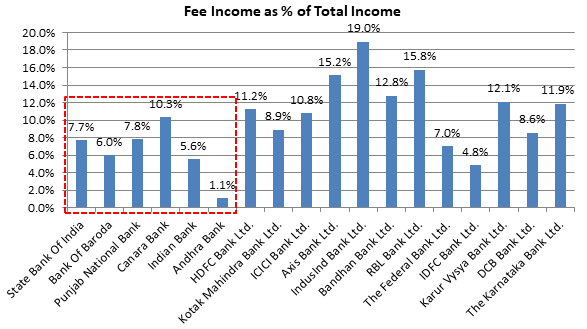
Fee Income As % Of Total Income
We can see how all the PSU Banks have had weaker Fee Income as share of Total Income compared to their private peers.
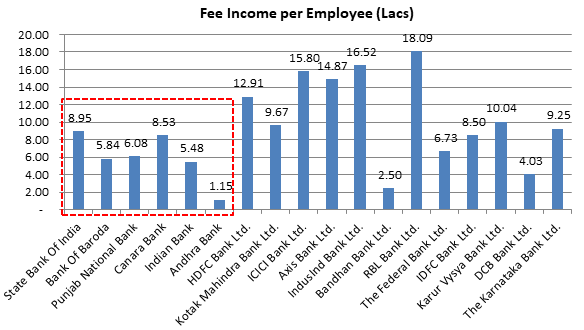
Fee Income per Employee
Banking Sector being a service industry, productivity of the employee is a key variable to track. We can see how productivity of PSU bank employees have been. However, there are few private banks as well who have lower Fee Income per Employee as of FY18.
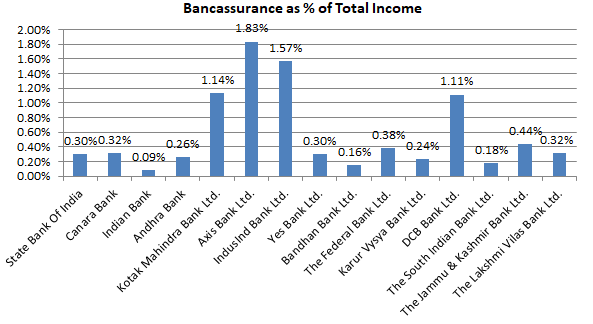
Bancassurance Of A Bank
Bancassurance is selling of life assurance and other insurance products and services by banks. This is another higher yield product for banks. Higher the better!
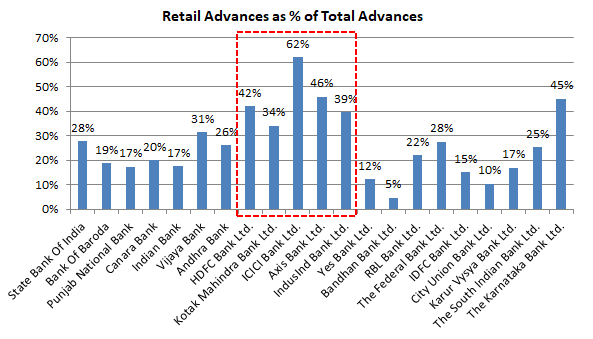
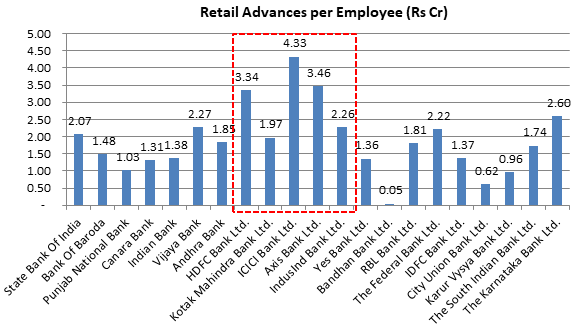
Retail Advances
We can see how some of the most valued banks have better performance in terms of Retail Advances.
Retail Advances per Employee (Rs cr)
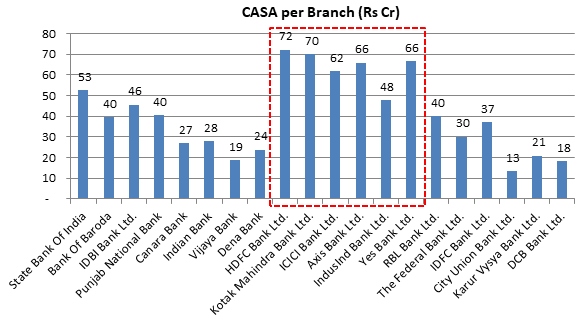
CASA
Better CASA numbers by top private banks has helped them achieve lower cost of funds and hence maintain better NIMs.
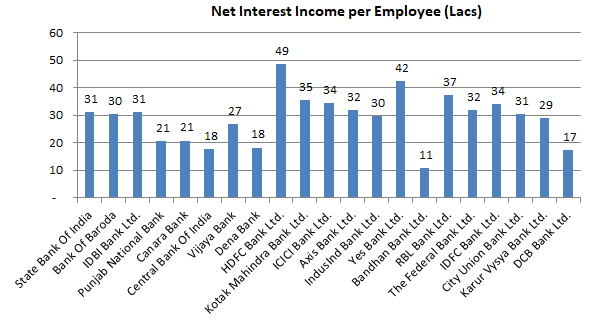
Net Interest Income Per Employee
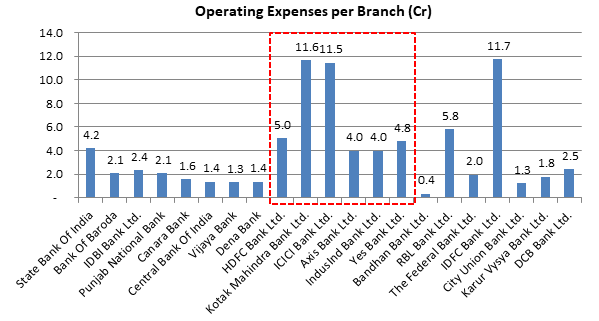
Operating Expense per Branch
We can see how the top performing private banks have higher operating expenses per branch! These banks are continuously investing to sustain their growth rates.
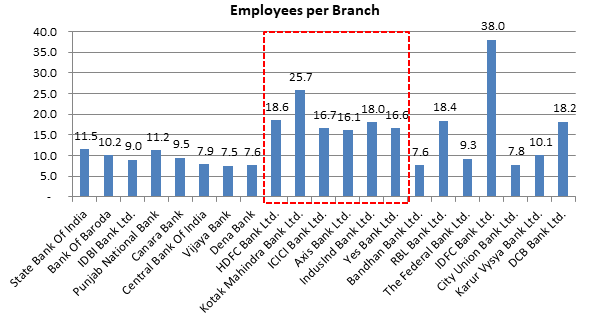
Employees per Branch
We can also see how the top performing private banks have higher employees per branch! i.e. higher sales force, customer service executives etc. Top private banks have double employees per branch compared to their PSU peers. Banking is the only sector where the PSU companies have lesser employees than their private counterparts!
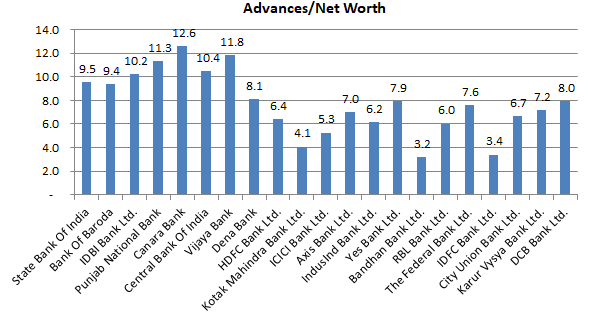
Leverage (Advances/Net Worth)
The following chart describes how many times its Net Worth is the respective bank’s Advances.
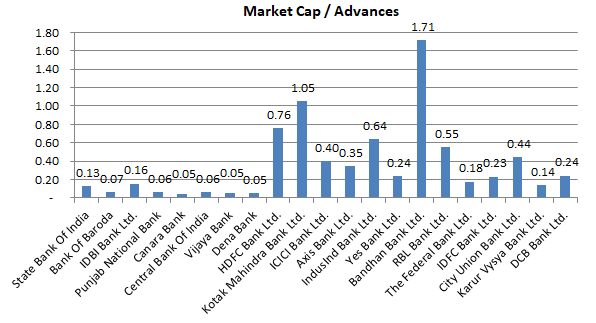
Market Cap / Advances
The following chart describes how many times is the market valuing the bank’s loan book.
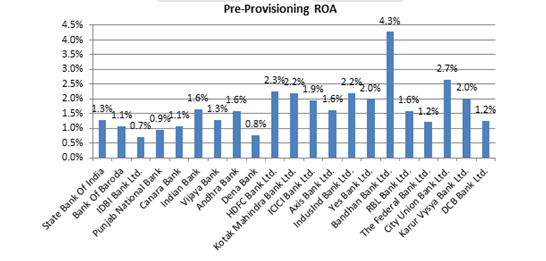
Pre-Provisioning ROA
It is basically the ROA of a bank assuming zero Provisioning for the bank.
Pre-Provisioning ROA = [Report PAT + (Provisioning)*(1 – tax)] / [Total Assets]
Debit & Credit Card
The higher the number of credit and debit cards, better is the bank’s fee income. HDFC Bank has more credit cards than entire PSU banking sector combined!
| Bank | No Of Debit Cards Issued (May-18) | No Of Credit Cards Issued (May-18) |
| State Bank of India | 28.3 cr | 65 lacs |
| Bank of Baroda | 5.3 cr | 1.3 lacs |
| Punjab National Bank | 6.4 cr | 3.3 lacs |
| Canara Bank | 4.5 cr | 2.2 lacs |
| Central Bank Of India | 3.0 cr | 96,000 |
| Indian Bank | 1.8 cr | 85,000 |
| Bank Of India | 5.4 cr | 2.1 lacs |
| Union Bank Of India | 2.2 cr | 2.2 lacs |
| Vijaya Bank | 65.6 lacs | 62,000 |
| HDFC Bank | 2.5 cr | 1.1 cr |
| Kotak Mahindra Bank | 0.9 cr | 15.5 lacs |
| ICICI Bank | 4.3 cr | 52 lacs |
| Axis Bank | 2.3 cr | 46 lacs |
| IndusInd Bank | 0.4 cr | 8.2 lacs |
| Yes Bank | 0.2 cr | 3 lacs |
| Bandhan Bank | 1.1 cr | NA |
| Federal Bank | 0.7 cr | NA |
| Karur Vysya Bank | 0.4 cr | NA |
| City Union Bank | 18.1 lacs | 5,500 |
Exposure Towards Various Sectors
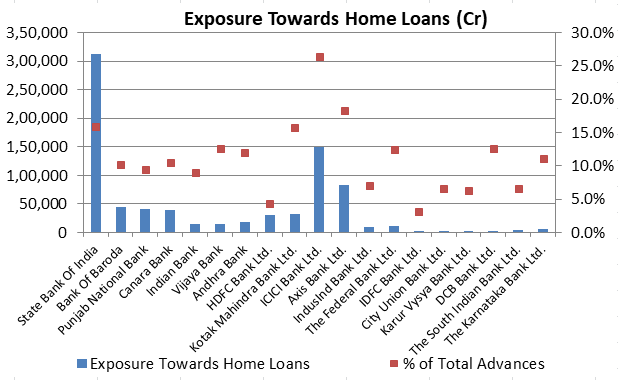
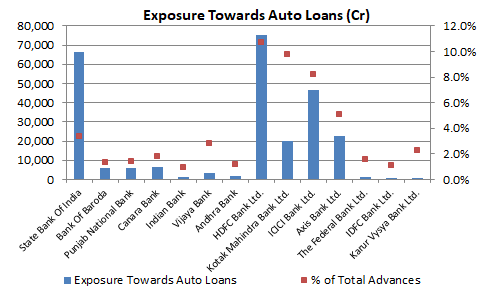
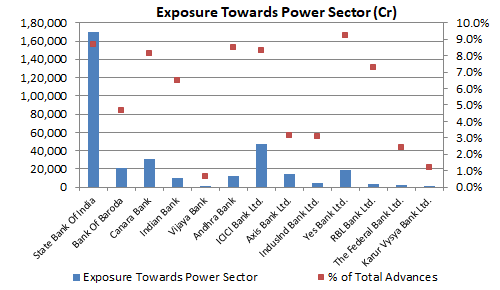
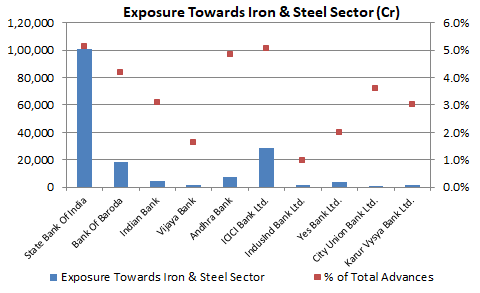
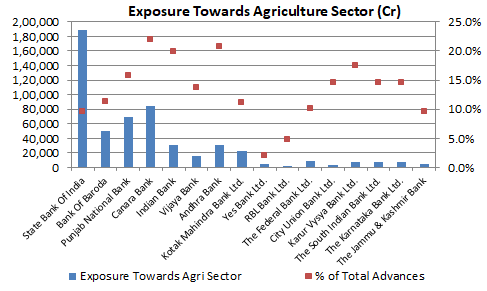
Below we have shown credit exposure of each bank towards different sectors, wherever the data was available.
Home Loans
Interestingly, almost ~25% of ICICI Bank’s book comprises of home loans.
Auto Loans
HDFC Bank is most aggressive when it comes to Auto Loans, with over 10% of its book comprising of Auto Loans. We can see, the top private banks have higher portion of exposure towards auto loans compared to their PSU peers.
Power Sector
Iron & Steel Sector
Agriculture Sector
Disclaimers :
The information herein is used as per the available sources of bseindia.com, company’s annual reports & other public database sources. Alpha Invesco is not responsible for any discrepancy in the above mentioned data. Investors should seek advice of their independent financial advisor prior to taking any investment decision based on this report or for any necessary explanation of its contents
Future estimates mentioned herein are personal opinions & views of the author. For queries / grievances – support@alphainvesco.com or call our support desk at 020-65108952.
SEBI registration No : INA000003106
Readers are responsible for all outcomes arising of buying / selling of particular scrip / scrips mentioned here in. This report indicates opinion of the author & is not a recommendation to buy or sell securities. Alpha Invesco & its representatives do not have any vested interest in above mentioned securities at the time of this publication, and none of its directors, associates have any positions / financial interest in the securities mentioned above.
Alpha Invesco, or it’s associates are not paid or compensated at any point of time, or in last 12 months by any way from the companies mentioned in the report.
Alpha Invesco & it’s representatives do not have more than 1% of the company’s total shareholding. Company ownership of the stock : No, Served as a director / employee of the mentioned companies in the report : No. Any material conflict of interest at the time of publishing the report : No.
The views expressed in this post accurately reflect the authors personal views about any and all of the subject securities or issuers; and no part of the compensations, if any was, is or will be, directly or indirectly, related to the specific recommendation or views expressed in the report.
Stay Updated With Our Market Insights.
Our Weekly Newsletter Keeps You Updated On Sectors & Stocks That Our Research Desk Is Currently Reading & Common Sense Approach That Works In Real Investment World.