Disclaimer: The Blog on ‘Indian Defence’ is not a recommendation to buy / hold / sell any stock. The published post is for information purpose only. Please read the detailed disclaimer at the bottom of the post.
Defence Industry Of India
India has the third largest military in the world and is the sixth largest spender in defence. In the below write-up, I have tried to put forward basic facts about Indian Defence Sector and how it has evolved over with time.
Before I begin with the write-up, I will explain few terms which might be new for some readers:
BE – Budget Estimates. When the Union budget is presented in Parliament and passed for the financial year, it’s called the Budget estimates (BE).
RE – Revised Estimates. Estimates done in the middle of the ongoing year.
Revenue Expenditure –
Revenue expenditure refers to the expenditure which neither creates any asset nor causes reduction in any liability of the government. It is recurring in nature. Examples: Payment of salaries, pensions, interests, expenditure on administrative spends, defence services, health services, grants to state, etc.
Capital Expenditure –
Capital expenditure refers to the expenditure which either creates an asset or causes a reduction in the liabilities of the government. It is non-recurring in nature. Examples: Loan to states and Union Territories, expenditure on building roads, flyovers. Factories, purchase of machinery etc., repayment of borrowings, etc.
Defence Industry’s Budget
Military Expenditure as % of GDP has broadly fallen to ~1/3rd on global level from 6.2% in 1960 to 2.2% in 2017. Saudi Arabia has had highest share of GDP allocated towards its military.
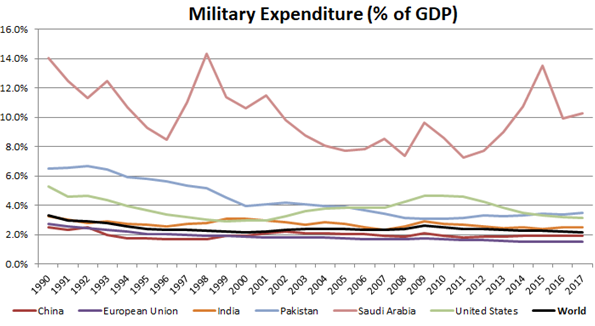
(Source – World Bank)
India’s share of Defence in GDP has been volatile between 1960 to 1990, and post then has been broadly declining. It can also be seen the Defence share rising during the years of war in 1962, 1965, 1971 and 1999. The current Defence share in GDP is lowest in many decades.
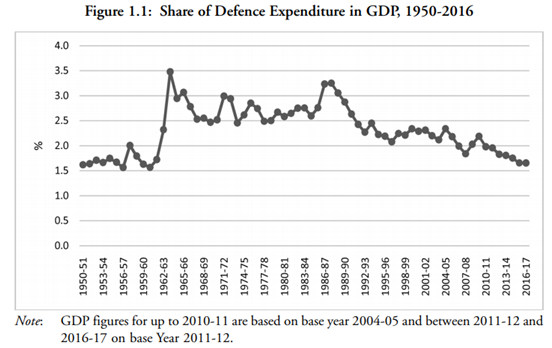
(Source – IDSA : Indian Defence Industry by Laxman Kumar Behera)
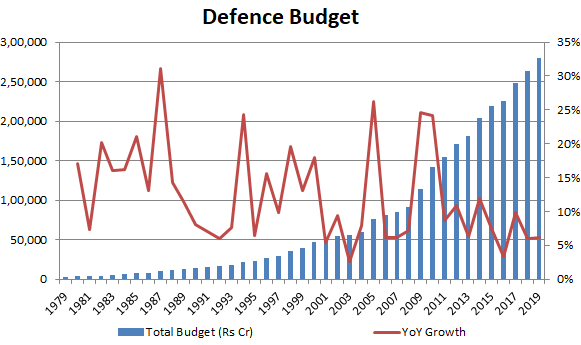
However, in absolute terms, our Defence budget has consistently increased. It has increased from 3,000 cr in 1980 to 2.8 lakh cr currently. Over 40 year period, it has grown at ~12% CAGR rate, with growth rates slowing down off lately.
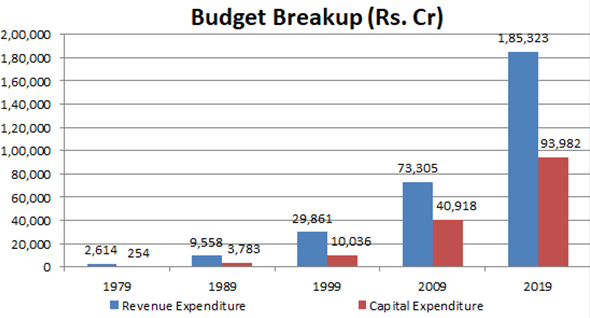
Defence Industry’s Budget Breakup
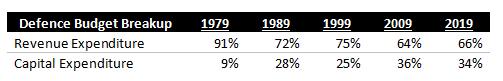
The budget is divided into 2 parts: (i) Revenue Expenditure and (ii) Capital Expenditure. Both of them are described in the beginning of the write-up. Revenue Expenditure mainly comprises of military pays and allowances, etc. and Capital Expenditure comprises of investing in machinery and equipment’s. As we can see below, the share of Capital Expenditure has increased from 9% of defense expenses in 1980 to 33% currently, with major share growth occurring in 1980s and 2000s.
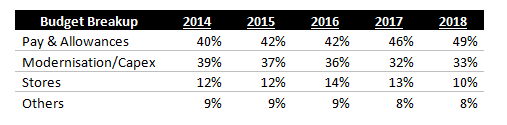
Recent breakup of the Defence budget since 2014 shows how the Pay & Allowances share has increased from 40% to 50% under the current government. At the same time, the Capex part of the budget has fallen.
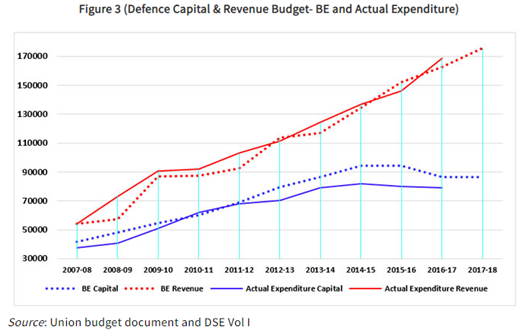
Capital Expenditure
The lower Capex spending can also be seen with Actual spending consistently being lower than the Budgeted spending, as can be seen in the below chart (blue line).
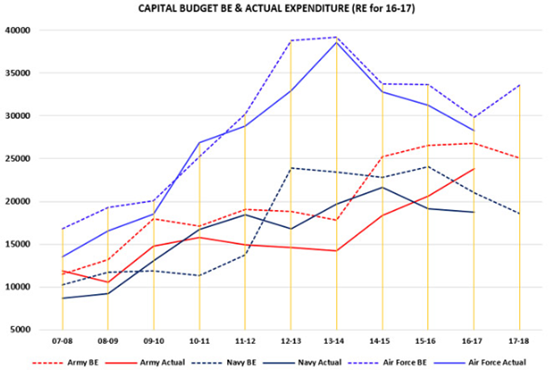
A further breakup of the above chart shows the lower modernisation and capex spend compared to the Budget Estimates in our Army, Navy and Air Force.
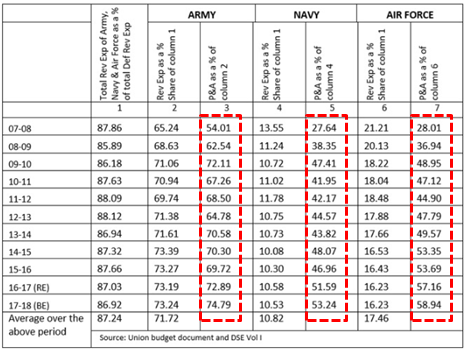
Pension and Allowances
Total Pension share has more than doubled from ~45,000 cr in 2013-14 to ~1,10,000 cr in 2018-19. The same can be seen with increase of Revenue Exp share and increase of Pension and Allowances share in the Revenue Exp over the last decade across Army, Navy and Air Forces.
Armed Personnel’s
From the major defence economies, India, Saudi Arabia and Pakistan are the only countries who have seen an increase in armed personnel’s over last 3 decades. In fact, India has crossed China in 2016 to have the highest Armed Personnel’s in the world. Rest all major countries have seen a decline in the number.
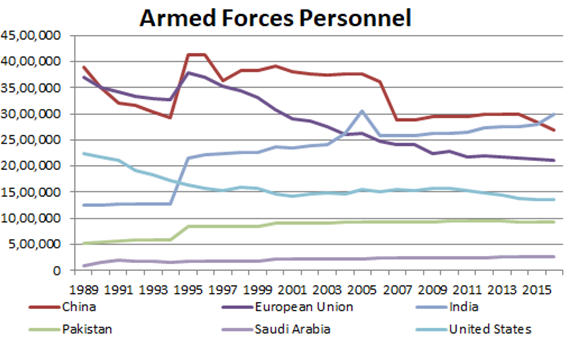
(Source – World Bank)
Defence PSUs (DPSUs)
Total share of DPSUs in total Defence Expenditure (Revenue and Capital) has increased from 39,700 cr in 2006-07 to 92,600 cr (BE) in 2015-16.
Defence PSUs at a glance can be seen below:
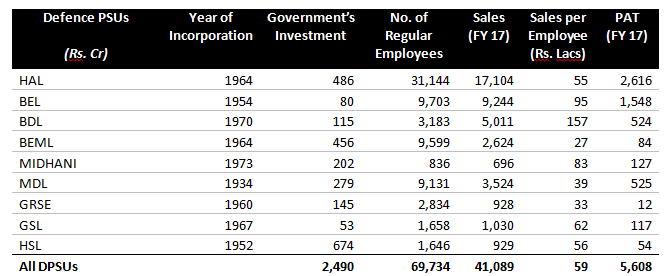
(Source: Department Of Defence Production)
R&D in Defence
Share of R&D in Defence Expenditure has increased from ~1.5% in 1967 to 5%+ currently.
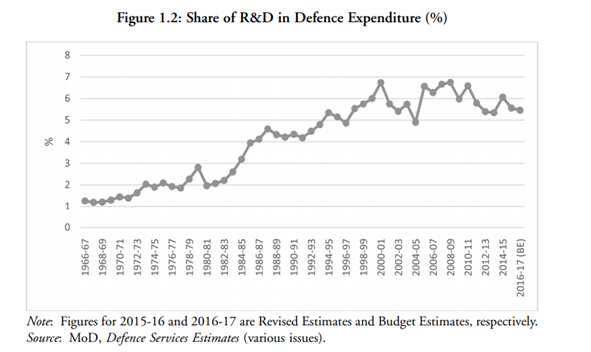
(Source – IDSA : Indian Defence Industry by Laxman Kumar Behera)
Disclaimers :
The information herein is used as per the available sources of bseindia.com, company’s annual reports & other public database sources. Alpha Invesco is not responsible for any discrepancy in the above mentioned data. Investors should seek advice of their independent financial advisor prior to taking any investment decision based on this report or for any necessary explanation of its contents
Future estimates mentioned herein are personal opinions & views of the author. For queries / grievances – support@alphainvesco.com or call our support desk at 020-65108952.
SEBI registration No : INA000003106
Readers are responsible for all outcomes arising of buying / selling of particular scrip / scrips mentioned here in. This report indicates opinion of the author & is not a recommendation to buy or sell securities. Alpha Invesco & its representatives do not have any vested interest in above mentioned securities at the time of this publication, and none of its directors, associates have any positions / financial interest in the securities mentioned above.
Alpha Invesco, or it’s associates are not paid or compensated at any point of time, or in last 12 months by any way from the companies mentioned in the report.
Alpha Invesco & it’s representatives do not have more than 1% of the company’s total shareholding. Company ownership of the stock : No, Served as a director / employee of the mentioned companies in the report : No. Any material conflict of interest at the time of publishing the report : No.
The views expressed in this post accurately reflect the authors personal views about any and all of the subject securities or issuers; and no part of the compensations, if any was, is or will be, directly or indirectly, related to the specific recommendation or views expressed in the report.
Stay Updated With Our Market Insights.
Our Weekly Newsletter Keeps You Updated On Sectors & Stocks That Our Research Desk Is Currently Reading & Common Sense Approach That Works In Real Investment World.