Disclaimer: The Blog on ‘Stainless Steel Industry’ is not a recommendation to buy / hold / sell any stock. The published post is for information purpose only. Please read the detailed disclaimer at the bottom of the post.
Stainless Steel Properties
Stainless steels are iron alloys with a minimum of 10.5% chromium. A thin layer of oxide is produced (known as ‘passive layer’) on the surface by Chromium. Chromium helps in improving resistance to corrosion. Other metals which might be added to stainless steel include Nickel, Molybdenum, Titanium, and Copper. Non-metals which can be added include Carbon and Nitrogen. These alloying elements help to enhance the structure and properties such as formability, strength and cryogenic toughness.
Difference Between Stainless Steel and Carbon Steel:
Steel is an alloy made out of iron and carbon. The main difference between the two is in the components that are added to the steel to make it useful for its intended purposes. While in the case of Carbon Steel, Carbon is the main alloying element. In carbon steel, the properties are mainly defined by the amount of carbon it has. For this alloy, the amounts of other alloying elements like chromium, manganese, cobalt, tungsten are not defined. Whereas, Stainless steel has high chromium content that forms an invisible layer on the steel to prevent corrosion and staining. Carbon steel has a higher carbon content, which gives the steel a lower melting point, more malleability and durability, and better heat distribution. The other differences include: there is an in built chromium oxide layer in stainless steel, which is not present in carbon steel; Carbon steel can corrode whereas stainless steel is protected from corrosion; Stainless steel is preferred for many consumer products and can be used decoratively in construction, while carbon steel is often preferred in manufacturing, production and in projects where the steel is mostly hidden from view; Stainless Steel has lower thermal conductivity than Carbon steel.
Types of Stainless Steels
Broadly there are 5 different groups of Stainless Steel, namely – Austenitic, Ferritic, Martensitic, Duplex, and Precipitation Hardening. Properties of commonly used Stainless Steel are as following:
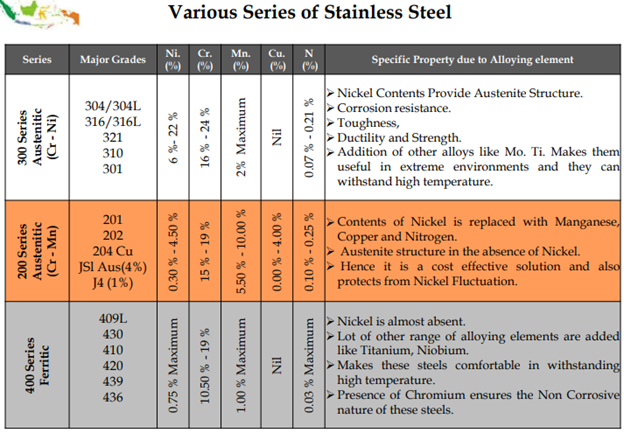 Source: metalbulletin
Applications of Stainless Steel Based On Series
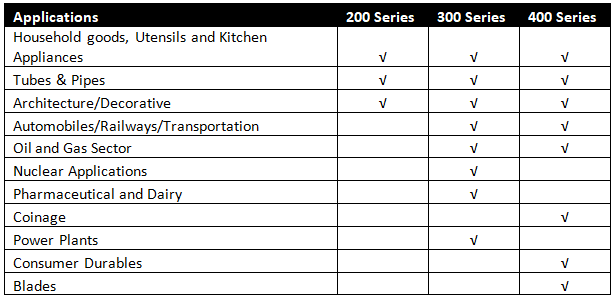 (Source: Ventura)
The consumption pattern of Stainless Steel has changed over last couple of decades. It has not only been increasingly consumed in the existing end user industries, but it has been started to be used in newer industries as well. This is one of the major reason, it is the metal growing at one of the fastest rates since 1980.
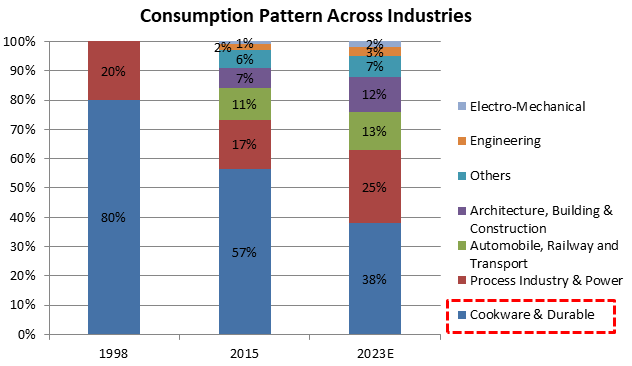
As we can see, Cookware & Durable took lions share in the consumption of Stainless Steel in 1998, and as with time the metal has found applications in new industries, its share towards Cookware has continued to drop. We can also see below the growth rate of various metals over last 25 years:
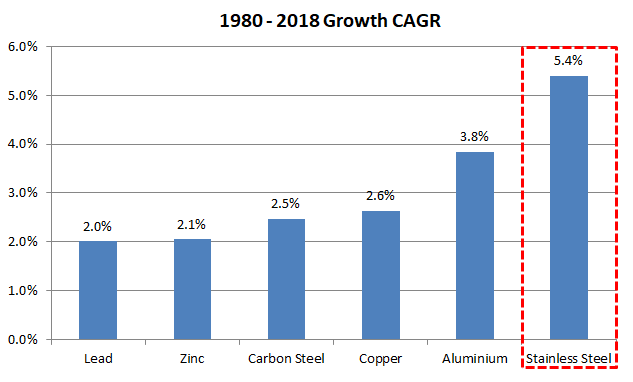 (Source: worldstainless)
Global Stainless Steel Supply
Global annual Stainless Steel production currently stands at ~50 mn tons as of 2018. We can see how China has increased its share from just 4% to 50%+ over last 2 decades.
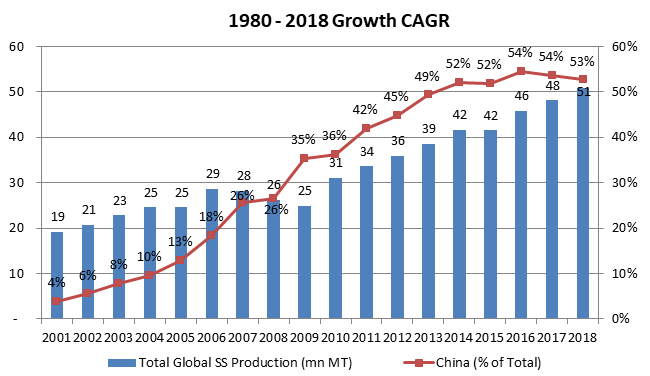 (Source: worldstainless)
Infact, in weight terms, taking 1990 as the basis year, SS growth has surpassed plastic growth!
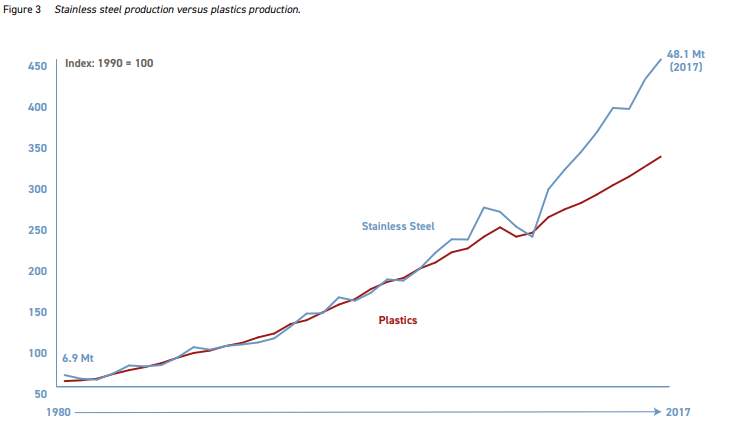 (Source: worldstainless)
Global Stainless Steel Demand
Global SS demand as per region can be seen in the below chart. Needless to say, China has major share with being just little shy of 50%. With production share consistently higher than consumption share, China is a consistent exporter of SS in the world, just like many other metals and industries.
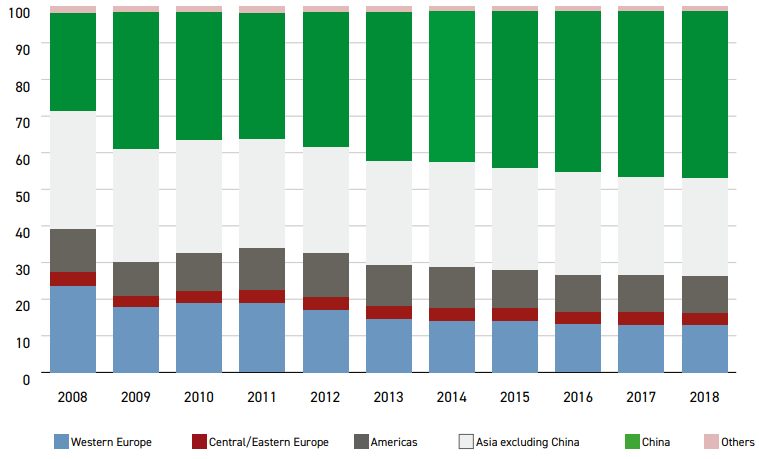 (Source: worldstainless)
Stainless Steel Use Per Capita
We can see how India is lagging far behind in per capita SS consumption compared to other major developed and developing economies.
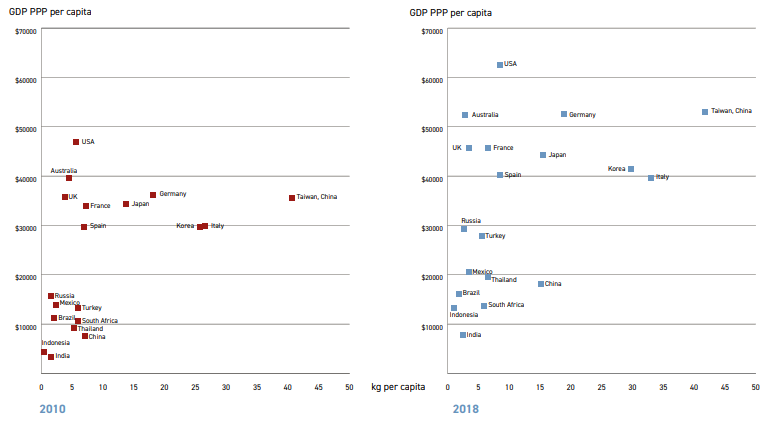 (Source: worldstainless)
Global Stainless Steel Capacity Utilizations
As per the Q1FY19 investor presentation by an European Stainless Steel major, China (& Asia) have lower utilizations compared to their western counterparts.
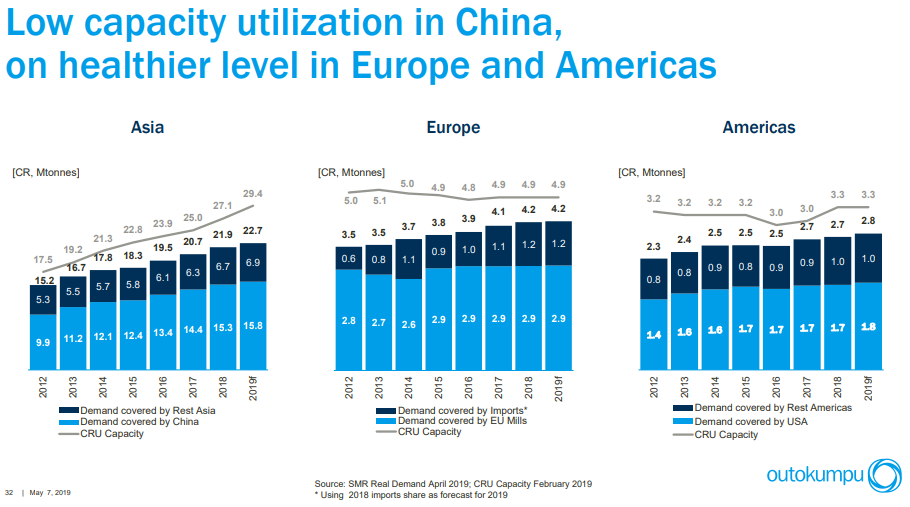 (Source: Outokumpu Q1FY19 PPT)
As per the 2018 Annual Report of Outokumpu, the major SS producing companies globally are as following:
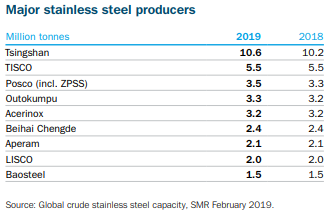 (Source: Outokumpu AR 2018)
Data of some of the global listed companies can be seen below. All 3 are European companies and we can see their production have broadly remained stagnant in last 4 years.

As correctly guessed, it is the Chinese companies, who are capturing the global demand growth in the SS industry. The biggest Chinese company named Tsinghshan (unlisted and hence difficult to find much data) has ~ 8 – 10 mn tons of capacity, comprising of 15-20% of the global capacity (it had 2% global share in 2008; Source: Tsingshan 2013 PPT)! This company is currently setting up ~2 mn tons of plant in Gujarat, India, which will be mainly for the 304 series hot-rolled flat products as well as cold-rolled products to markets in East and South East Asia.
Stainless Steel Prices
SS has major fluctuation in its major raw material prices (covered in detail below) and hence its pricing globally is comprised of 2 parts, (i) base price and (ii) alloy surcharge. SS price over last two decades can be seen below. During most of the time, broadly the base price has remained flat around ~1000 EUR/t, and it is the alloy surcharge which has fluctuated, leading to volatility in SS prices.
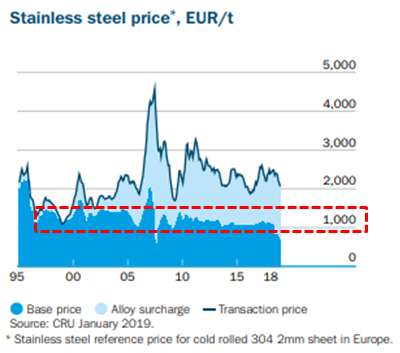 (Source: Outokumpu AR 2018)
An interesting way how the Chinese major Tsingshan is trying to increase its global market share is by offering long term contracts (for slabs and hot-rolled coil) in order to compete. The company can do that as Tsingshan Indonesia has captive power and mines its own nickel and chrome (major raw materials for SS), making it an extremely low cost producer.
Interestingly, the Chinese imports in US and Europe peaked in 2014 – 15 period, and has dropped substantially post the protectionist measures taken by them. Naturally, it has led to diversion of these exports by Chinese companies towards other emerging markets including India.
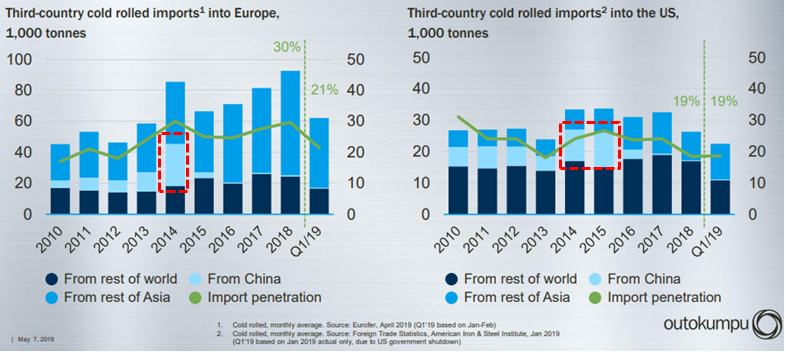 (Source: Outokumpu Q1FY19 PPT)
Raw Materials in Stainless Steel Production
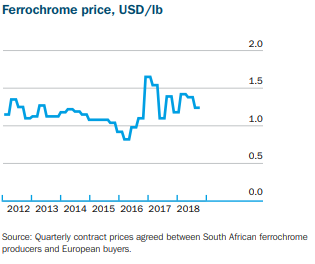
The major raw materials in Stainless Steel production are Nickel and Chromium (ferrochrome), which also majorly impact the SS prices globally.
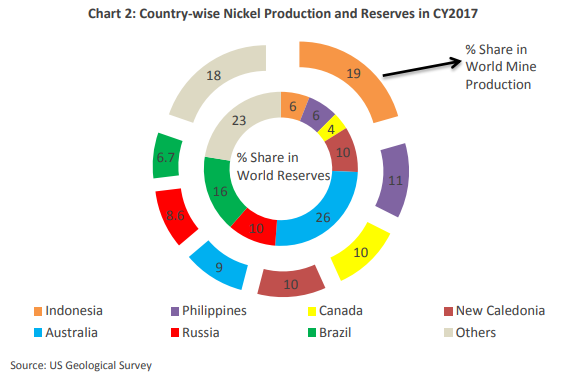
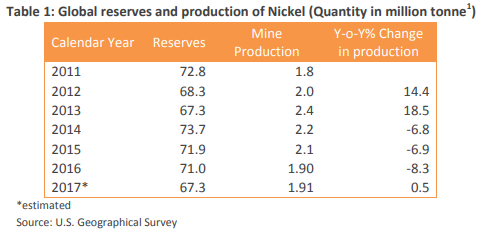
Nickel: Today mines worldwide extract more than 2.25 million tons of nickel annually. Stainless steel accounts for 2/3rd of Global Nickel demand. China accounts for more than half of the annual global demand for nickel. Only 10 years ago, Chinese nickel consumption represented less than 20% of global demand. Nickel demand in India is around 45,000 tonnes and is met only through imports. Although a few states in India report nickel reserves, no effective nickel production has taken place since FY05. In India, Nickel occurs as oxides, sulphides and silicates. It is found as oxide in Odisha which has 93% of the India’s nickel resources.
 (Source: CARE Report)
 (Source: CARE Report)
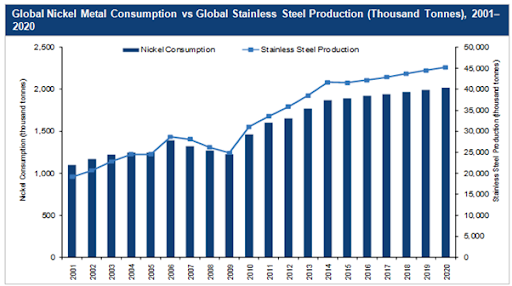
The relation between Nickel consumption and stainless steel production since 2000 can be seen below.
 (Source: miningfrontier)
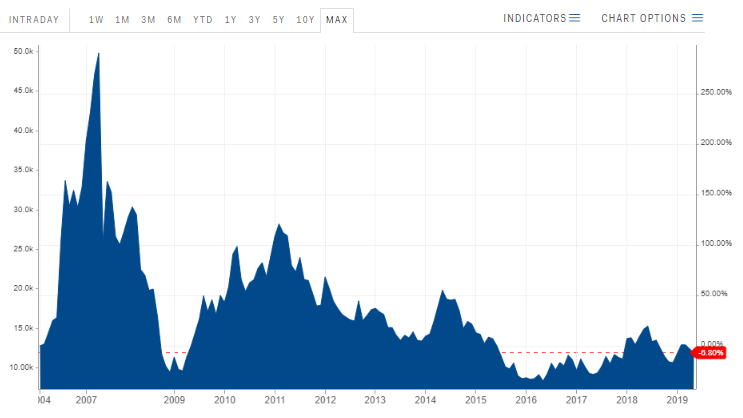
We can see below how the Nickel prices have remained volatile in last 15 years.
 (Source for live Nickel prices: businessinsider)
As we can see below, the Austentic (300 series) has highest Nickel content, and the Chinese major Tsingshan coming to India also has mainly 300 series products, because of its captive Nickel mines capability. The other Indian Stainless Steel companies plan to combat against it by increasing the share of Ferritic SS which has virtually zero Nickel content.
 (Source: CARE Report)
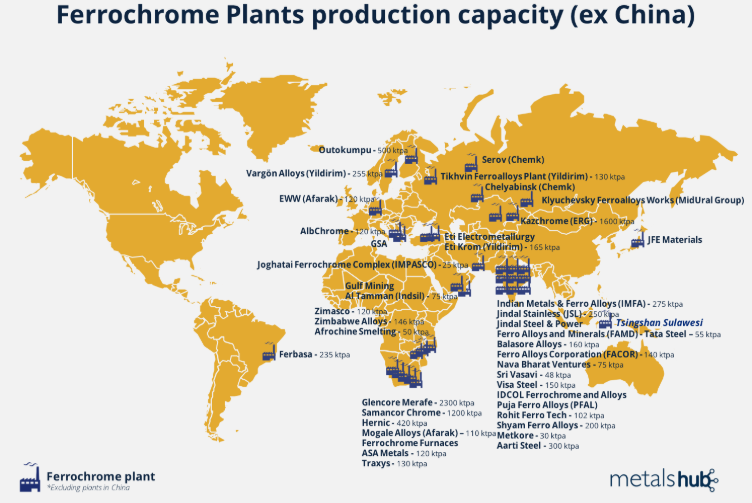
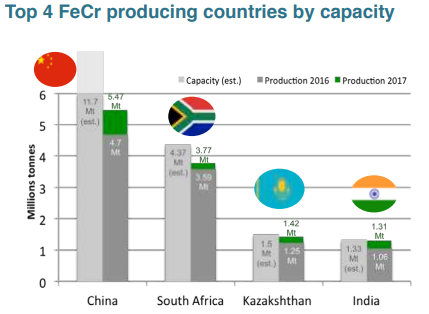
Ferrochrome: Ferrochrome (FeCr) is an alloy of chromium and iron containing between 50% and 70% chromium. The Producer of stainless steel & tool steel are the largest consumer of ferrochrome and charge chrome. It is chromium that confers upon stainless steel its remarkable corrosion resistance. Out of the total world chrome ore output about 95% is used to produce ferrochrome for the metallurgical industry, with 2% used in chemical industry and the balance 3% in the refractory and foundry industry. Later majority of which is used in Cast Iron, Alloy Steels & Stainless Steel. China is the world’s top consumer of chromium, as well as the top stainless steel producer. However, it has no chromium production at all. South Africa is the largest ferrochrome and chromite ore producer. India’s chromium production came in at 3.2 million MT in 2017.
 (Source: metals-hub)
 (Source: ICDA)
 (Source: Outokumpu AR 2018)
Indian Stainless Steel Industry
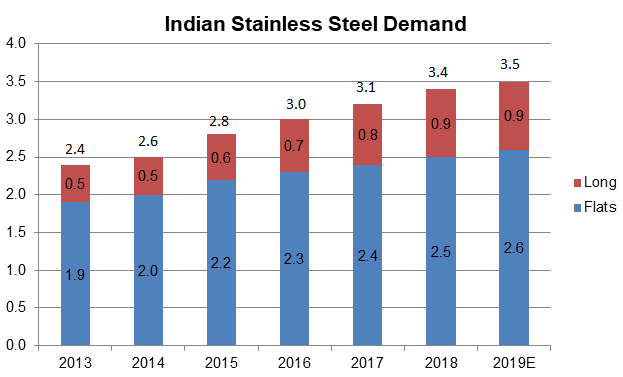
The Indian Stainless Steel industry is of the size of ~3.5 mn tons out of the global industry size of ~50 mn tons, i.e. ~7% of the global size. Indian Stainless Steel industry growth over last few years can be seen in the below chart:
 (Source: Ventura)
As can be seen, ~75% of the SS industry is dominated by the flat products. Currently, India’s SS consumption per capita is ~2.7 kg, whereas the global average is ~6 kg per capita. With all the major industries being catered by SS bound to grow, the SS industry in India is expected to continue to grow at healthy rate.
 (Source: Ventura)
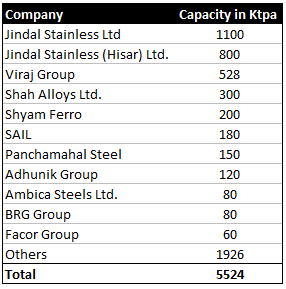
The Jindal Stainless group led by Ratan Jindal has ~35% of the installed Indian Stainless Steel capacity. However, the group currently accounts for ~50% of the SS supply in India. It has increased from ~25% supply 4-5 years back, with unorganized share reducing and leading to many smaller mills lying unutilized.
Imports
Past Measures taken by Indian Government against Imports:
Over the past few years, the Indian government has taken a number of measures to support the domestic stainless steel industry. Imports reached nearly ~530,000 in 2015- 16 (~20% of annual consumption in FY16) lead to major hardships for the industry. The government has undertaken the following measures to alleviate the hardships:
-
Anti-dumping duty:
In June 2015, the government imposed an Anti-dumping duty of US$ 180- 316/MT on imports of 304 grade flat products from China, Malaysia and South Korea for the next 5 years (till June 2020). However, importers circumvented the existing Anti-dumping duty by importing products of widths different from those mentioned in the duty order at lower prices. Later, in August 2017, the government extended the same duties on imports of all widths, which increased the effectiveness of this duty.
-
Imposition of stainless steel quality order – 2016:
The government imposed a stainless steel quality order in 2016, effective from Feb 2017, which mandates BIS certification on the supply of stainless steel (including imports) used especially for utensils and kitchen appliances. This will help control the import of sub-standard quality materials, especially from China.
-
Imposition of countervailing duty (CVD) against imports from China:
In September 2017, the government imposed a CVD of 18.95% on imports of stainless steel flat products from China for the next 5 years (till Sept’22). This has helped reduce the threat of Chinese imports.
Current Scenario:
Currently, imports of Stainless Steel in India are on the rise. SS import is happening majorly in the 300 series, and mainly from the Indonesian plants of the Chinese companies. Post import duties on the Chinese companies by the Indian government, they have started to route through Free Trade Agreement (FTA) ASEAN countries like Indonesia, Malaysia & Vietnam. China, Japan & Korea have excess capacities which they try to dump in India and these countries have FTA with Indonesia. The landed cost of the Indonesian SS is cheaper than the Indian price by $100-$200.
Import of stainless steel from Indonesia into India has grown nearly nine times from nearly 8,000 tonne in 2017-18 to 67,000 tonne in 2018-19 (annualized basis), with Chinese producers ramping up their capacity in Indonesia. Infact, global exports of Indonesian stainless HRC totalled 877,990 tonne during January to September 2018, a year-on-year jump of 171% from 324,108 tonne in 2017. Top Indian Stainless Steel manufacturers have requested the government to increase basic custom duty on stainless steel from 7.5% to 15% (for carbon steel goods, the basic custom duty is already 15%).
Raw Materials
Unfortunately, all the major raw materials (Nickel, Chrome, and scrapped Stainless Steel) is being imported in India. Strangely, there is 2.5% import duty on the import of these raw materials, which further increases the domestic SS manufacturers’ raw material costs and makes it more difficult for them to compete against the imports.
Recent Developments in Indian Stainless Steel Industry
Recently, demand is growing sharply by some of the end-users of the SS industry. Some of them are mentioned below:
Railways: There are multiple areas in railways itself where the demand for SS is increasing.
- Station Infra: Railways is planning to modernize its infrastructure, particularly in the foot-over and rail-over bridges. This would increase demand mainly Ferritic series.
- Coaches: SS finds use in coach sub-assemblies like side-wall, roof arch, trough floor and retention tanks. These components will be used in LHB (Linke Hofmann Busch) model coaches and other variants. Over the next 4-5 years, Railways plans to produce around 10,000 stainless steel coaches annually.
Railways has mandated the use of SS in all new passenger coaches by FY20. Additionally, it is looking to double its coach orders from 2,500 coaches in FY18 to 5,000 coaches annually in FY20.
- Train18 / Vande Bharat Express: Train 18, which will run at the top speed of 160 kmph, is going to replace premium trains like Rajdhani and Shatabdi. The coaches of this train are going to have stainless steel bodies.
- Wagons: Currently wagons account for 20% of the railways’ annual SS bill (including for wagons, coaches and metro coaches) of ~Rs. 2,500 cr, which is expected to reach Rs. 3,500 – 4,000 cr in FY20. The railways are currently procuring ~10,000 – 11,000 wagons annually. In total, 100,000 wagons are required in next 5 years, each needing around 8-10 tonnes of stainless steel, depending on the model and design. Presently, the total number of wagons in the country is over 2,00,000.
Housing:
With different initiatives like ‘housing for all’, usage of stainless steel would increase as SS is widely used in home furniture and appliances.
Kitchenware:
Even today SS finds ~50% of its use in the Cookware and Durables segment. With millions of Indians getting discretionary income, demand of kitchenware is expected to grow.
Auto:
Post the implementation of the Bharat-VI norms, the consumption in the commercial vehicles is going to increase from 15 – 20 kgs to 40 kgs per vehicle. Current auto industry demand for SS is 120,000 TPA. The consumption is expected to grow by 30-35% in the auto sector.
Disclaimers :
The information herein is used as per the available sources of bseindia.com, company’s annual reports & other public database sources. Alpha Invesco is not responsible for any discrepancy in the above mentioned data. Investors should seek advice of their independent financial advisor prior to taking any investment decision based on this report or for any necessary explanation of its contents
Future estimates mentioned herein are personal opinions & views of the author. For queries / grievances – support@alphainvesco.com or call our support desk at 020-65108952.
SEBI registration No : INA000003106
Readers are responsible for all outcomes arising of buying / selling of particular scrip / scrips mentioned here in. This report indicates opinion of the author & is not a recommendation to buy or sell securities. Alpha Invesco & its representatives do not have any vested interest in above mentioned securities at the time of this publication, and none of its directors, associates have any positions / financial interest in the securities mentioned above.
Alpha Invesco, or it’s associates are not paid or compensated at any point of time, or in last 12 months by any way from the companies mentioned in the report.
Alpha Invesco & it’s representatives do not have more than 1% of the company’s total shareholding. Company ownership of the stock : No, Served as a director / employee of the mentioned companies in the report : No. Any material conflict of interest at the time of publishing the report : No.
The views expressed in this post accurately reflect the authors personal views about any and all of the subject securities or issuers; and no part of the compensations, if any was, is or will be, directly or indirectly, related to the specific recommendation or views expressed in the report.
Stay Updated With Our Market Insights.
Our Weekly Newsletter Keeps You Updated On Sectors & Stocks That Our Research Desk Is Currently Reading & Common Sense Approach That Works In Real Investment World.