Indian stock market performance over 5 year period ranges, from 2004 till now, on fundamental and market cap basis, helps us understand how the markets have gone through different cycles.
Additionally, it broadly overlaps the rule of UPA 1.0 (2004 – 2009), UPA 2.0 (2009 – 2014), and Modi 1.0 (2014 – 2019), which also helps us understand how corporate India performed in those periods.
Some key points to remember for the below analysis is –
- Set of companies with market cap ranked 501 to 1500 is based on market cap as of 29th March, 2019. It is broadly market cap range between ~2,500 cr and ~120 cr.
- All the index compositions are as of September 2019 quarter. The index composition would vary a lot over last 15 years, however the latest composition includes companies who would have performed really good over last 15 years and hence now they are part of the index.
- LTM market data stands for latest date of update (18th October, 2019).
Analysis of Indian Stock Market Performance
1] Valuations
a) NIFTY Market Cap as % of Total India Market Cap
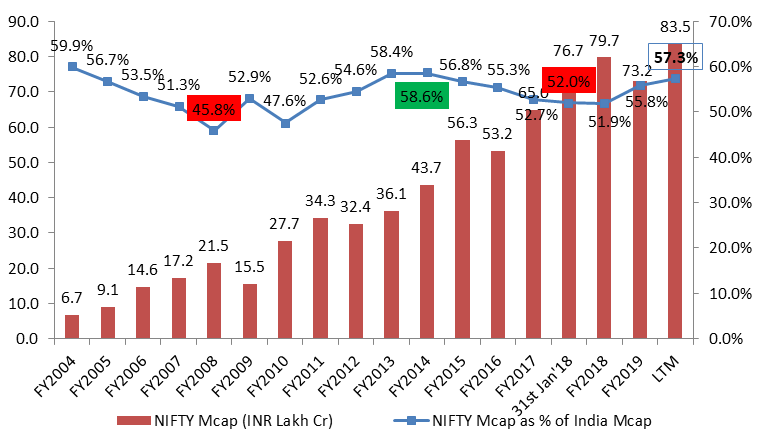
NIFTY market cap performance as % of Total listed companies’ market cap has always been in range of ~50% – 60%, with exception of March 2008. It can be seen that when the number reaches ~50% (or below), the stock market performance has broadly peaked out (basically the small & mid cap stocks have seen their bull run and have dwarfed the NIFTY capitalization in percentage terms), and when the number is in vicinity of ~60%, stock market performance has bottomed and new bull run for mid/small cap is ready to begin (basically the small & mid cap stocks have been through a crash and the major capital has accumulated in the NIFTY/large cap companies increasing its capitalization in percentage terms). The same ratio as of 18th October 2019 stands at 57.3%.
b) Market Cap growth
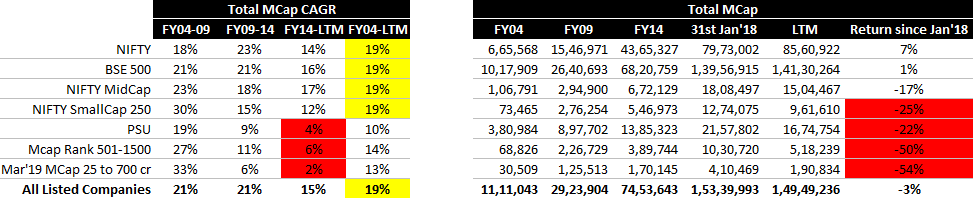
Market Cap performance has slowed down for Small & Mirco cap and PSU companies in last 5 years. Basically most of the gains in the bull-run got vanished, reducing the category wise performance. However, stock specific performance might have different story as well. Also, broadly in last 15 years, stock market performance has given ~19% CAGR returns irrespective of NIFTY / BSE 500 / NIFTY Midcap / NIFTY SmallCap 250.
c) Earnings Valuations
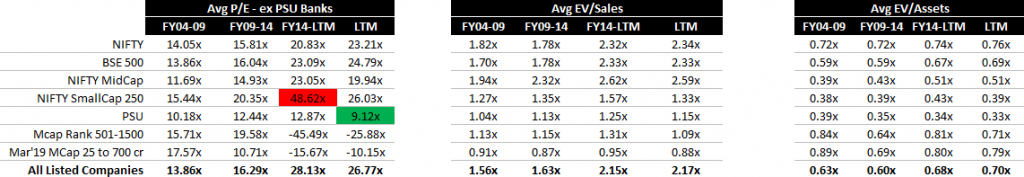
Clearly NIFTY SmallCap 250 companies have been trading at very high Price to Earnings valuations (ex of PSU Banks) on an average in FY 2014 to 18th October 2019 period. Interestingly, ex of PSU Banks’ P/E valuations have seen an uptrend every 5 year period in most of the categories. Whereas, on EV/Sales parameter NIFTY MidCap companies have garnered premium compared to other categories.
2] Debt /Credit Growth
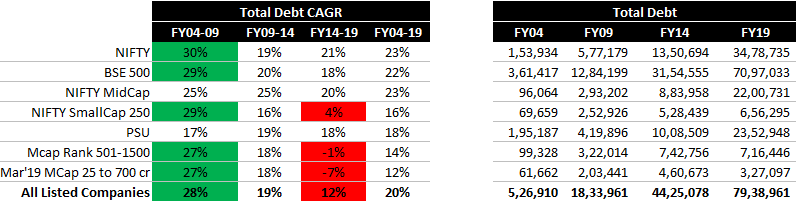
Major credit growth (in % terms) occurred during the FY 2004 – 2009 period, with 5 year CAGR as high as 27% – 30%. For all other categories of companies except PSUs, the credit growth was lowest in FY 2014 – 2019 period, with smallcap companies actually witnessing a de-growth of Total Debt number.
a) Debt as % of Total Listed Companies Debt
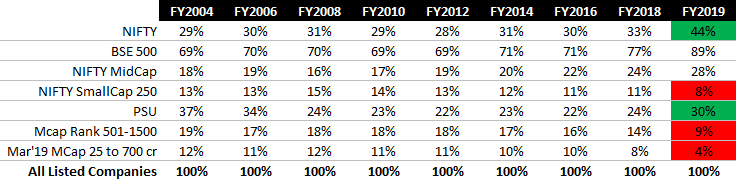
Leverage share of NIFTY companies have increased from 29% to 44% since FY 2004. Also, the shift in FY 2019 over FY 2018 is very visible – credit was accessible to NIFTY companies more easily compared to Mid, Small and Micro cap companies, increasing its share to 44%.
3] Total Assets Growth
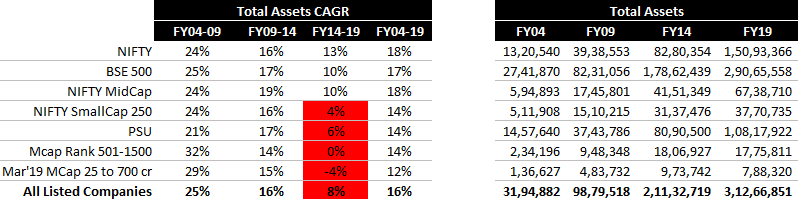
A very similar story can be seen for Total Assets growth as well, except that even PSU companies did not see any major growth in Total Assets in FY 2014 – 2019 period. Also, interestingly, Total Assets for All Listed Indian companies have grown almost by ~10x in last 15 years from ~32 Lakh cr to ~312 Lakh cr.
a) Asset Turnover
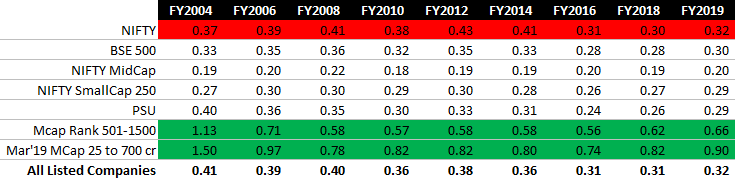
Strangely, Small and Micro cap companies have had better asset turns compared to mid and large cap companies consistently.
4] Profitability Growth
a) Profit After Tax Growth
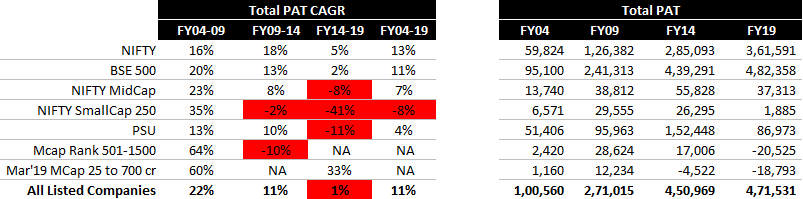
Profit After Tax almost remained flat with 1-2% CAGR growth in FY 2014 – 2019 period for all listed companies and BSE 500. Profitability of corporate India has been stagnant over the last 5 years. The same de-grew for mid, small and micro cap companies. However, a major portion of this number is influenced by NPA recognition by PSU banks in the last 5 years.
b) Profit After Tax Growth – ex of PSU Banks
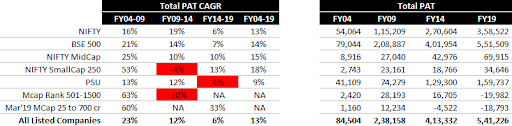
Profitability growth for all the categories, excluding PSU Banks in the respective category shows much better performance. However, the same has been very modest compared to previous 5 year periods.
c) Return on Assets and PAT Margin
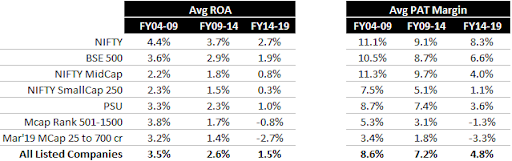
Average last 5 year ROA and PAT Margin has been decreasing every 5 year period. Both have almost halved in FY 2014 – 2019 period, compared to a decade ago in FY 2004 – 2009 period. Comparing same data for ex-PSU banks category reduces the deterioration in the profitability, however still the trend is downwards only.
d) Return on Assets and PAT Margin – ex of PSU Banks

e) PAT as % of All Listed Companies’ PAT

NIFTY companies accounted for 99% of total PAT of all listed companies in FY 2018, and there was negative contribution from small and micro cap companies. No wonder NIFTY index performed better compared to Midcap and Smallcap index in last 2 years. Interestingly, FY 2004 saw 51% of listed companies’ PAT coming from PSU companies, which has fallen down to 18% in FY 2019. The same data excluding the PSU banks can be seen below –

Excluding PSU banks increases the PSU companies’ PAT share from 18% to 30% for FY 2019.
5] Revenue
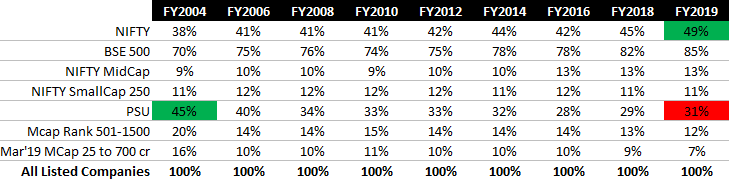
Since 2014, consolidation in revenue has happened towards NIFTY, BSE 500 and Midcap category companies. Small and Mirco cap companies seem to have lost their share. Interestingly, PSUs accounted for 45% of listed companies’ revenues in FY 2004, which has now come down to ~30%.
Disclaimers :
The information herein is used as per the available sources of bseindia.com, company’s annual reports & other public database sources. Alpha Invesco is not responsible for any discrepancy in the above mentioned data. Investors should seek advice of their independent financial advisor prior to taking any investment decision based on this report or for any necessary explanation of its contents
Future estimates mentioned herein are personal opinions & views of the author. For queries / grievances – support@alphainvesco.com or call our support desk at 022-48931507.
SEBI registration No : INA000003106
Readers are responsible for all outcomes arising of buying / selling of particular scrip / scrips mentioned here in. This report indicates opinion of the author & is not a recommendation to buy or sell securities. Alpha Invesco & its representatives do not have any vested interest in above mentioned securities at the time of this publication, and none of its directors, associates have any positions / financial interest in the securities mentioned above.
Alpha Invesco, or it’s associates are not paid or compensated at any point of time, or in last 12 months by any way from the companies mentioned in the report.
Alpha Invesco & it’s representatives do not have more than 1% of the company’s total shareholding. Company ownership of the stock : No, Served as a director / employee of the mentioned companies in the report : No. Any material conflict of interest at the time of publishing the report : No.
The views expressed in this post accurately reflect the authors personal views about any and all of the subject securities or issuers; and no part of the compensations, if any was, is or will be, directly or indirectly, related to the specific recommendation or views expressed in the report.
Stay Updated With Our Market Insights.
Our Weekly Newsletter Keeps You Updated On Sectors & Stocks That Our Research Desk Is Currently Reading & Common Sense Approach That Works In Real Investment World.