Indian Sugar Industry – A Brief Overview
Sugar Production Process
Globally, sugar is mainly extracted from either sugarcane or sugar beet. Around 80% of global sugar is extracted from sugarcane, and remaining 20% from sugar beet. In India, sugar is extracted from sugarcane.
Sugar extraction process has by-products which also can be sold / processed for additional source of revenue. The process is as following:
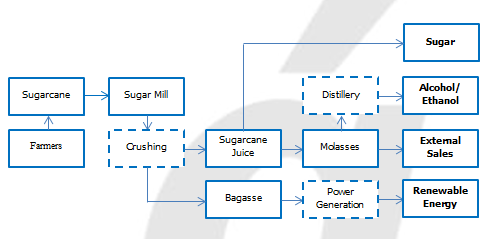
Sugarcane from farmer is crushed to get sugarcane juice and Bagasse as the by-product, which can further be used in power generation, partly used for captive consumption and remaining is sold. The sugarcane juice is further processed to get sugar and Molasses, which can either be sold directly or further processed in the distillery to give Alcohol. This Alcohol can either be Industrial Alcohol which is sold to Chemical companies for industrial consumption or potable Alcohol (liquor); or Ethanol which can be used for blending in the fuel. On an average, 95 kg of sugar and 10.8 litres of ethanol can be produced from 1 tonne of sugarcane.
Sugar Industry
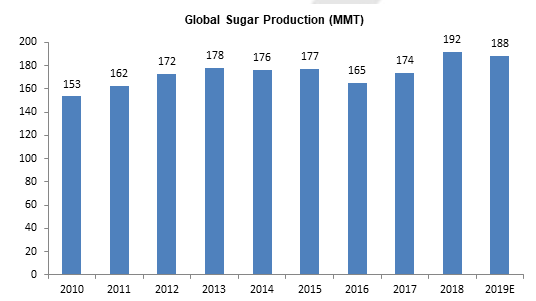
Global Sugar Industry
Top ten sugar producing countries are as following:
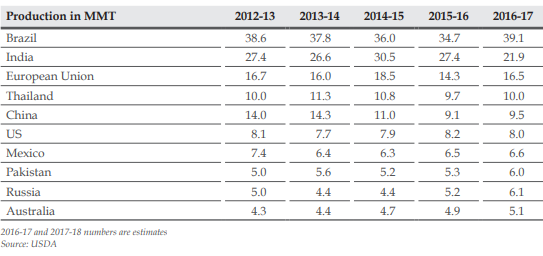
Brazil, India, EU and Thailand together account for over 50% global sugar production. India is 2nd largest sugar producer in the world and the largest sugar consumer country. Brazil is the largest sugar producer with 50-60% of sugarcane used for production of Ethanol as a substitute for the fuel.
Indian Sugar Industry
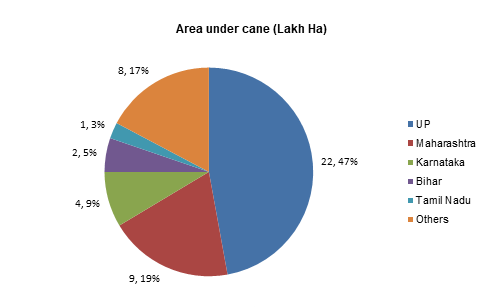
Indian sugar industry is worth more than Rs. 80,000 cr (from sugar and its by-products). The Indian sugar industry supports ~5 crore sugarcane farmers across India and hence has high political importance as well. Major statistics about Indian sugar industry can be found at the ISMA website (http://www.indiansugar.com/Statics.aspx). As of 31st July 2017, there are 732 sugar mills in India with total sugar production capacity of ~34 mn tons of sugar. Roughly 50% of the mills are private. Indian sugar demand is around 25 mn tons. Indian per capita consumption of sugar was 18.8 kg v/s world average of 23 kg as of 2016. Total acreage of India is ~47 lakh ha. Acreage of sugarcane crop in different states is as follows:
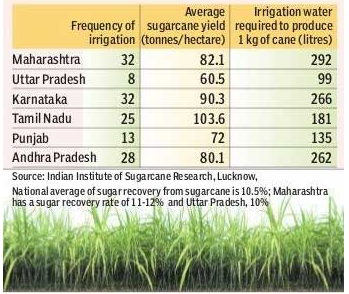
Sugarcane Yield :
It is the amount of sugarcane grown per unit area of farmland. Sugarcane yield of Maharashtra (~75-80 tons/ha) is higher than that of UP (~67-73 tons/ha). Indian cane yield is ~70-72 tons/ha.
Sugar Recovery Rate :
It is percentage of sugar produced in tons per ton of sugarcane crushed. Average recovery rate in Maharashtra is ~11.5% v/s. that of ~10.5% in UP.
UP has ~115 sugar mills, with most of them being private mills. Whereas, Maharashtra has more of co-operative mills. Also, average UP sugarcane crop age is 9.6 months v/s 12.85 months in Maharashtra. So UP farmers can grow some other crops for remaining time, like Wheat & Paddy. Additionally, UP cane requires 1/3rd of irrigation water compared to Maharashtra cane.
UP Sugar Industry
UP sugar industry accounts for more than 25% of Indian sugar production and is mainly comprised of private mills. Out of ~10 mn tons of sugar produced in UP, only 1/3rd is consumed by the state and remaining is sold out of UP, mainly to Kolkata and North Eastern market. The cost of production of sugar is higher in UP than other states in India.
The average per month return (Rs / ha) is highest for sugarcane crop compared to other crops like wheat and paddy in combination (considering sugarcane is a completely irrigated crop, hence it is compared with paddy and wheat cultivated as fully irrigated crops). However, sugarcane bears a longer risk cycle as compared to wheat and paddy due to its duration of ~9-10 months in UP as compared to 3-4 months for the latter. During 2010, the per month return of sugarcane in UP was Rs. 4,511 per hectare which is more than the combined per month return of wheat and paddy. The net rate of return (%) is 80% in sugarcane crop, whereas it is only 29% for wheat and 23% for paddy. Additionally, the Co 0238 cane variety recently introduced in UP is more profitable for the farmers than the traditional crop, leading to even higher inclination of farmers towards the crop. Last year ~35% of UP cane land was growing Co 0238 cane variety and by the end of this year ~50% of cane land is expected to grow Co 0238 cane variety. This would lead to more sugar production from same acreage of cultivation.
Sugarcane Crop And Sugar Demand & Supply
Sugarcane crop is a ‘ratoon’ crop. The new crop is grown from the stubble of the crop already harvested. So, the life of the crop planted is of multiple years, and generally new crop is not planted in the same farm area for few years.
There are 3 variants of sugarcane crop in India:
- Spring crop sown in March
- Adsali crop sown in July
- Autumn crop sown in September
Maturity time for adsali & spring crop is 18 months, whereas for autumn crop is 12 months. In India, the sugar season (SS) is form Oct-Sept. So SS17 means Oct’16 to Sept’17, with harvesting beginning in Oct’16. Total sugarcane crop production in India is ~300 mn tons.
Sugar Production And Consumption
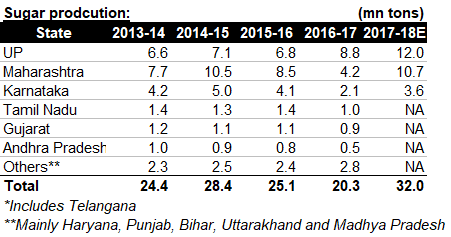
State-Wise Sugar Production
For SS17-18, UP & Maharashtra produced ~10+ mn tons of sugar each, out of the total ~30 mn tons of domestic sugar production, accounting for 2/3rd of Indian sugar production. State-wise sugar production historically has been as following:
Key Variables And Sugar Cycles
Factors Affecting Sugar Realizations In India
Indian sugar industry is highly regulated. Quantity of sugar to be sold and exported by mills is decided by the government, but at the same time government also bails out the industry with subsidies during the bad times.
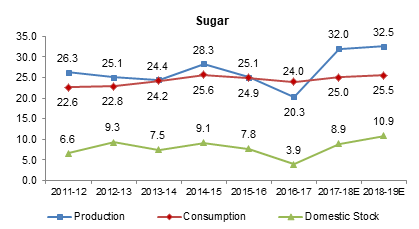
Sugar is a cyclical industry. If one needs to predict the sugar realisation, one should focus more on supply of sugar than its demand, as the demand is more or less stable around 25 mn tons and is growing slowly and steadily. ~70% of the sugar demand is B2B (FMCG sector) and only ~30%
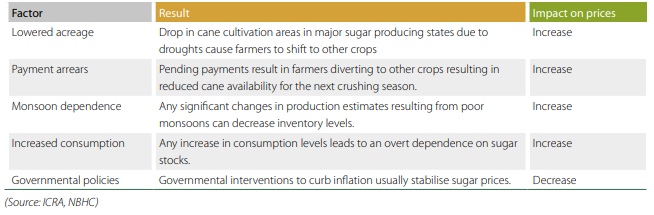
demand is from B2C side. It is the supply of sugar which is more volatile and affects the sugar prices. The same can be seen in the chart above showing the production and consumption of sugar. Eg: In 2016-17, when the sugar production (supply) was 20.3 mn tons compared to consumption (demand) of 25 mn tons, it lead to increase in sugar prices. The supply of sugar depends majorly on the following factors:
2016-2017 Sugar Cycle
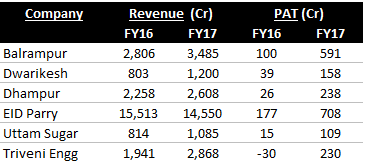
SS16-17 was a cycle when all the sugar stocks (specially UP based) gave multibagger returns. It was a sweet situation for UP sugar mills as the Maharashtra sugarcane production halved to ~4.5 mn tons, which lead to national level sugar supply shortage and increase in sugar price, and at the same time UP had bumper productions, allowing all UP based sugar mills to improve its results tremendously. Entire increase in realisation trickles down to PBT, as there is no parallel increase in prices, leading to margins expanding exponentially. The same can be seen through some sugar companies’ reported financials:
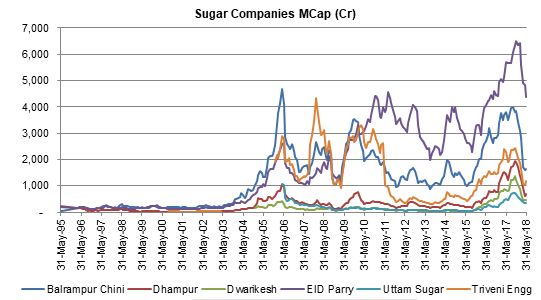
Based on the sugar cycles, the market price of the sugar companies also fluctuate, and these price movements are very quick. One can both make and lose money very quickly by investing in sugar companies’ stock. Let us have a look at market cap of some sugar companies in past 2 decades. We can see how market cap have already fallen by more than 50% even before the results of 1st loss making quarters had been declared by the companies. This is how much volatile are the prices of sugar companies’ stock. We can see similar speed and volatility even while increase in stock prices during industry uptrend.
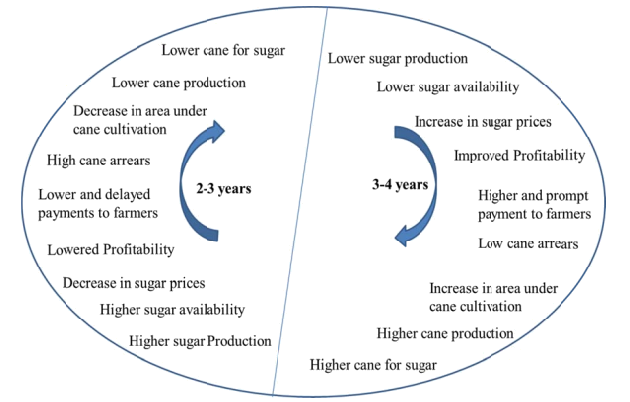
Sugar cycle in a nutshell is explained by the following diagram:
Sugarcane Prices
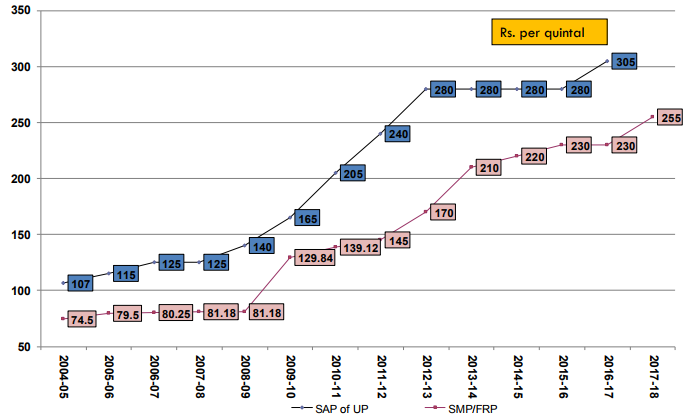
From Oct 2009, the concept of Statutory Minimum Price (SMP) of sugarcane was replaced with the ‘Fair and Remunerative Price’ (FRP) of sugarcane for 2009-10 and subsequent sugar seasons. FRP is the minimum price that a sugarcane farmer should receive for his cane. Though, some states like UP have State Advised Price (SAP) which is generally higher than the FRP.
FRP v/s. SAP in UP has been as follows:
Cane Arrears
Cane Arrears is the amount pending to be paid to the sugarcane farmer by the sugar mills. As per rule, mills need to pay farmers within 14 days of receipt of sugarcane. If failed, interest rate of 15% per annum is charged to the mills. Higher cane arrears discourages farmers to grow sugarcane in the next season.
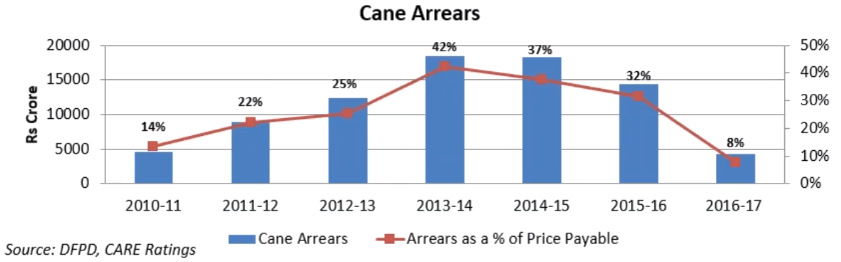
By May’18 end, cane arrears had reached over Rs. 20,000-22,000 cr due to dramatic fall in prices on the back of over production of sugar in this season. This 20,000 cr arrears is staggering ~25% of the total 80,000 annual amount to be paid to the farmers for their cane.
By-Products Of Sugar Industry
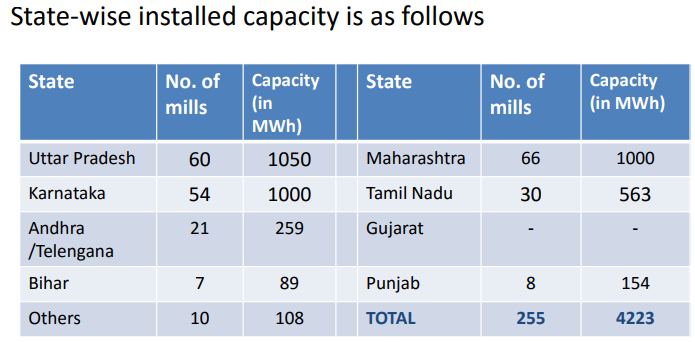
Cogeneration
1 tonne of sugar can produce ~300 kg of Bagasse which can be converted to ~130 KWh of power. The power generated by an integrated sugar mill is partially captively consumed and remaining is exported. India’s sugar industry has potential to export 7500 MW power, and total installed cogeneration capacity in all sugar mills is ~4200 MW, of which ~3200 MW is being exported by sugar mills to the grid.
Ethanol
Ethanol is a very key by-product for integrated sugar mills. We will elaborate on Ethanol industry in detail in our next blog.
Import/Export Of Sugar
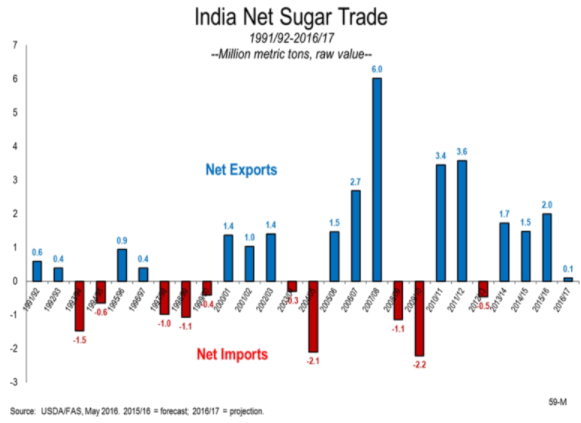
A solution to over production of sugar is to export sugar. Our 2 neighbouring countries, Bangladesh and Sri Lanka collectively import ~3.5 mn tonnes of sugar annually. Also, India has bilateral and SAARC free-trade agreements with both the countries. So if India is able to export some amount of additional production, it can help in stabilising the sugar supply and hence the sugar prices. Currently, the government has allowed 2 mn tons of sugar export till September 2018 to clear up surplus sugar stocks. If there is normal monsoon this year (CY2018), leading to production of another 32-33 mn tons of sugar in SS2018-19, India will have to export 5-6 mn tons of sugar next year.
Rangrajan Committee
The Rangrajan Committee had made salient recommendation to the government in 2012 to stabilise the sugar industry. The recommendations are as following:
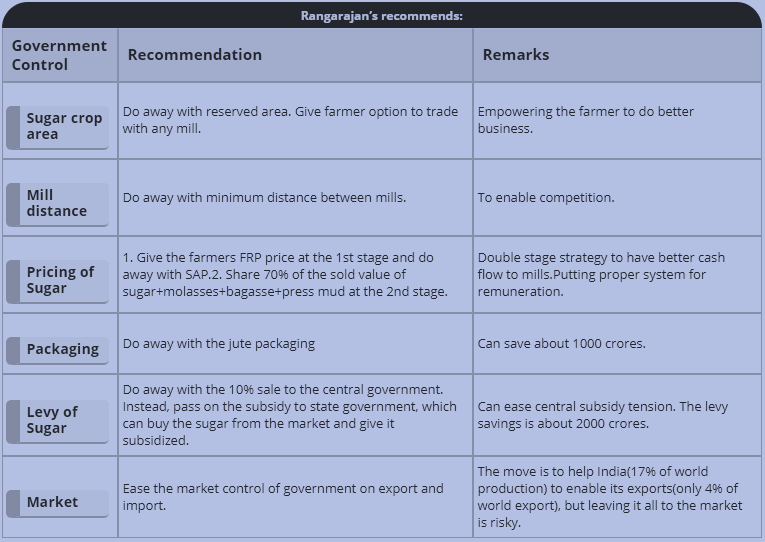
Most of these recommendations have been approved by state governments of Maharashtra and Karnataka. However, the recommendations are yet to be levied by the UP government.
Recent Regulatory Updates
Recently, due to oversupply of sugar, the prices of sugar have fallen leading to sugar mills selling sugar at losses and hence the mills are finding it difficult to clear their cane arrears. Cost of production of sugar is ~32-34 rs per kg (28-23 rs of sugarcane purchase cost and ~3-4 rs of conversion cost), so sugar mills need to sell sugar at 34-35+ rs per kg ex-mill prices to make profits.
Currently the ex-mill sugar price is 26-27 rs leading to huge losses for sugar companies. The quantum of loss is such that it undermines the EBITDA level profits from Cogeneration and Distillery division, leading to even consolidated EBITDA level losses for the sugar companies. The cane arrears have reached Rs. 20,000 + cr. To stabilize the situation, the government is considering following options:
- Cess on sugar (Rs. 1-1.5 per kg) to create a fund which will be used to clear the cane arrears.
- Production-linked subsidy on cane.
- Reduction of GST on ethanol from current 18% to 5%.
- Creating a buffer sugar stock of ~3 mn tons by the government.
- Fixing minimum ex-mill prices.
Going Forward
There seems to be a possible structural level change in the sugar industry via stable revenue from ethanol. There is another blog elaborating on this possibility, which I would encourage you to read next.
Disclaimers :
The information herein is used as per the available sources of bseindia.com, company’s annual reports & other public database sources. Alpha Invesco is not responsible for any discrepancy in the above mentioned data. Investors should seek advice of their independent financial advisor prior to taking any investment decision based on this report or for any necessary explanation of its contents
Future estimates mentioned herein are personal opinions & views of the author. For queries / grievances – support@alphainvesco.com or call our support desk at 020-65108952.
SEBI registration No : INA000003106
Readers are responsible for all outcomes arising of buying / selling of particular scrip / scrips mentioned here in. This report indicates opinion of the author & is not a recommendation to buy or sell securities. Alpha Invesco & its representatives do not have any vested interest in above mentioned securities at the time of this publication, and none of its directors, associates have any positions / financial interest in the securities mentioned above.
Alpha Invesco, or it’s associates are not paid or compensated at any point of time, or in last 12 months by any way from the companies mentioned in the report.
Alpha Invesco & it’s representatives do not have more than 1% of the company’s total shareholding. Company ownership of the stock : No, Served as a director / employee of the mentioned companies in the report : No. Any material conflict of interest at the time of publishing the report : No.
The views expressed in this post accurately reflect the authors personal views about any and all of the subject securities or issuers; and no part of the compensations, if any was, is or will be, directly or indirectly, related to the specific recommendation or views expressed in the report.
Stay Updated With Our Market Insights.
Our Weekly Newsletter Keeps You Updated On Sectors & Stocks That Our Research Desk Is Currently Reading & Common Sense Approach That Works In Real Investment World.