JPC (Joint Plant Committee) is the only institution in the country which is officially empowered by the Ministry of Steel/ Government of India to collect data on Indian iron and steel industry and post 1992 it molded itself into a facilitator for the industry.
In the following article we are briefly touching upon what steel production India achieved in various categories (BOF, EAF/IF Routes) in 2016-17 and what were the capacity utilization of top companies in the sector as per the JPC committee. This will be a data heavy read, so buckle your seats belts.
Crude Steel Production And Capacity Utilization
India’s total hot metal production for the year 2016-17 was at 128.28 mt and after refining it we generated crude steel of 97.94 mt, now when we say crude steel capacity and production, we do not include companies which sell pig iron and sponge iron (DRI) to customers, we only include companies which make end steel products (alloy & non alloy finished steel).
So when we calculate the capacity utilization we find that on an average the utilization of capacities in the steel sector was at 76% which has marginally improved from the previous number at 74% in 2015-16.
If we see the share of crude steel production by process (Basic Oxygen Route, EAF and IF) we find the following breakup as given in the pie chart.
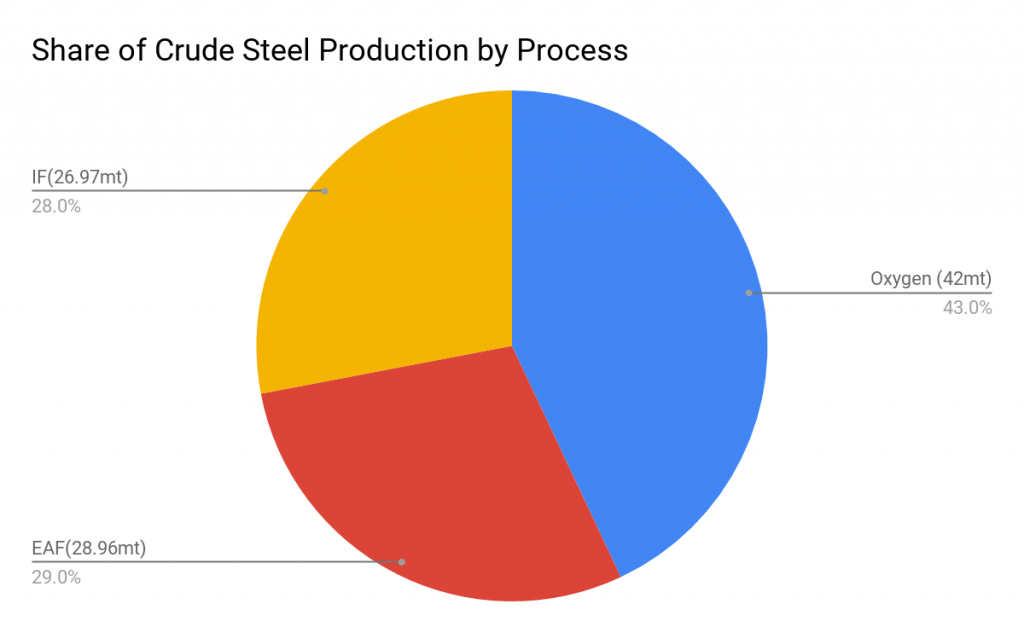
Public and Private sector companies shared 19:81 of the crude steel production in 2016-17 with SAIL and RINL producing 18.46 mt and the rest was produced by the private sector.
Pig Iron
Pig iron production for sale was 9.39 mt and one should remember that pig iron is an intermediary produced when you produce crude steel. Some companies like Kirloskar Ferrous and Sathavahana Ispat do not further process this intermediary and sell it to various foundries. For these pig iron producers it is their finished product, JPC committee separately accounts for the pig iron produced and sold by these companies. Domestic consumption of pig iron stood at 9.04 mt for the year 2016-17.
Sponge Iron
Domestic Production of sponge iron (DRI) stood at 28.762 mt, one should remember that sponge iron is further processed into steel in an EAF or IF furnace, the reason companies produce sponge iron is that it does not require coking coal as a raw material which we heavily import and is very expensive, it requires non coking coal or natural gas available in India and various reducing gases like Carbon monoxide and hydrogen.
Currently non coking coal route accounts for 23.91 mt or 83% of 26.76 mt of the total production on a capacity of 46 mt. Government is trying to push the production of crude steel via the DRI route as it saves a lot on the forex, and in order to achieve this the government has already taking measures to conduct non coking coal auction separately for the DRI producers which was earlier being amalgamated with the power companies. The government is also trying to provide predictable and consistent supply of natural gas for the producers.
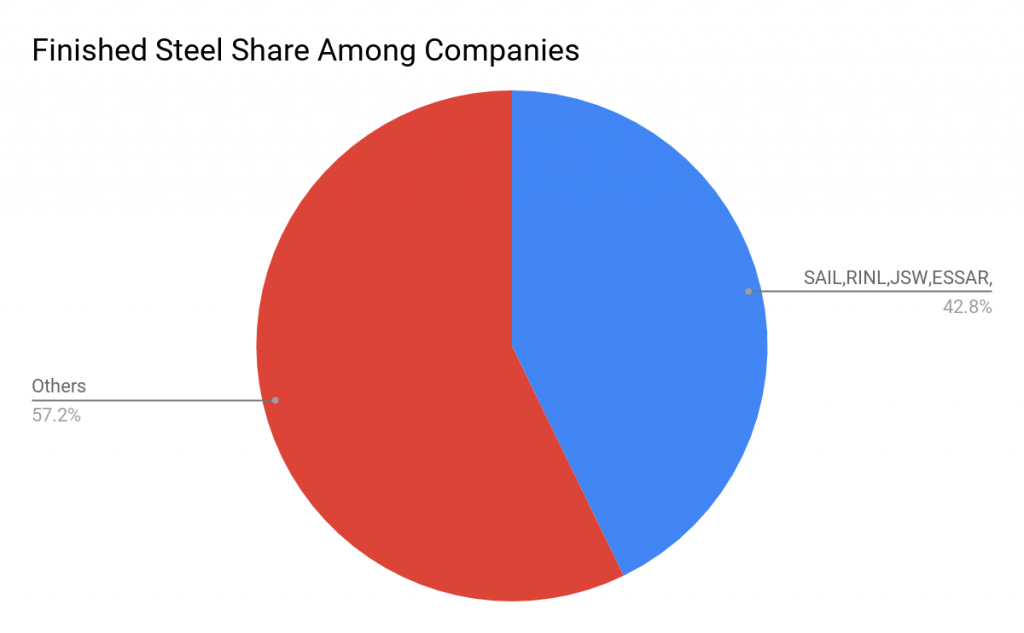
Finished Steel Share Among Companies
Total production for sale of finished steel has abnormal division among big integrated players like (SAIL,RINL,JSW, JSPL,TSL and ESSAR) and various other companies as shown in the pie chart below.
 In the non alloy category we saw bar & rods consumption at (34.9mt), HRC at (24.12 mt) structurals at (7.98 mt), GP/GC at (7.7 mt) and finally CRC at (8.56 mt).
Import & Exports
Although India is the third largest producer of steel but we used to import a significant quantity up until 2015-16 when the ministry imposed anti dumping duties and imposed Minimum import prices on various steel products for the safeguard of the domestic industry from the cheap Chinese imports. With these safeguard measures in place, India became a net exporter of steel in 2016-17 with exports being 8.242 mt and imports in the range of 7.226 mt.
China continued to be the largest supplier of steel and our largest export market was Belgium.
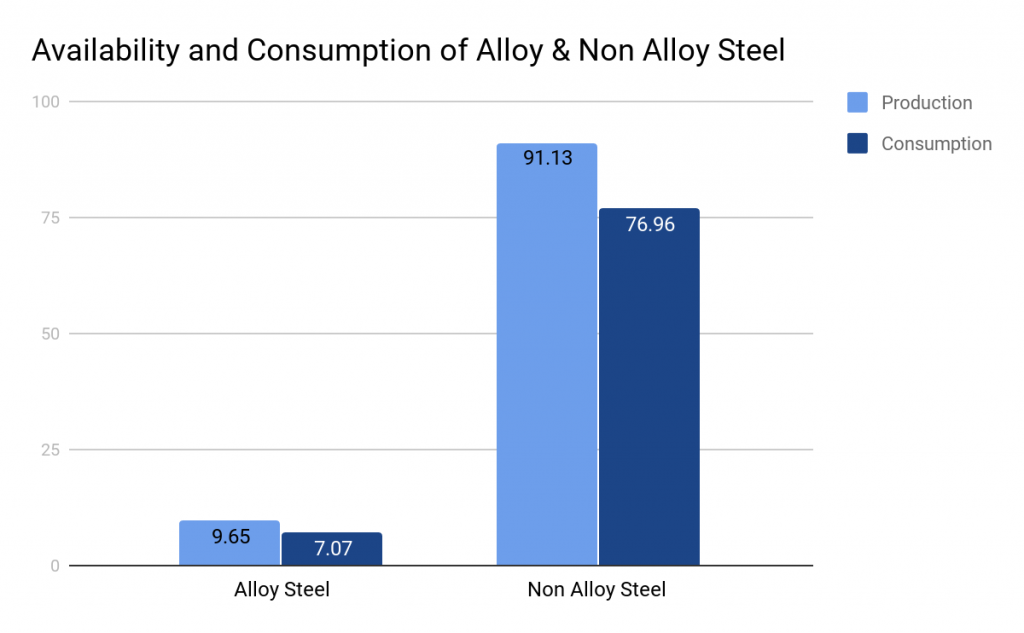
Availability And Consumption Of Finished Steel (Alloy And Non Alloy)
We saw a production of 91.13 mt of non alloy steel and simultaneous consumption of 76.96 mt. On the alloy steel we saw a production of 9.65 mt and simultaneous consumption of 7.07 mt. One should remember that alloy steel encompasses steels like stainless steel, electrical steel, special steel, ferro-chrome steel etc whereas non alloy steel is rest of the steel consumed whether it be long or flat like TMT, HRC, CRC, GP/GC etc. The bar chart below shows the breakup of it.
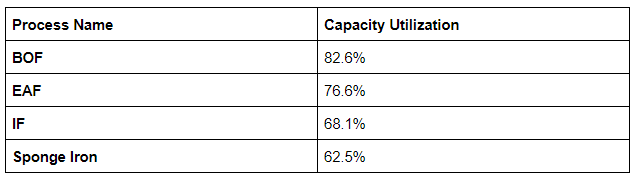
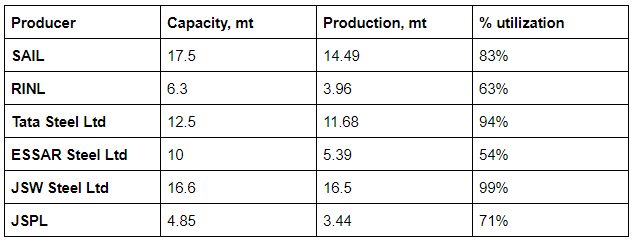
Iron And Steel Industry Capacity Utilization Process Wise
Currently we see that the demand for steel in the country is slackening and we see a lot of idle capacities across the spectrum of the industry, Ministry of steel has an ambitious target to achieve 160 kg of steel consumption per capita by 2030-31 and for this the first step is to run these plants at close to full or beyond full capacities. The following table shows where all the laggards are in terms of capacity utilization.
Category Wise Gross Production Of Steel In 2016-17
Non Alloy Net Production Of Steel 2016-17
In the non alloy category and further into the non flat sub category we saw the highest net production for bars and rods (34.95 mt), structurals at (7.9 mt) and finally rails at (1.1 mt).
If we further look into the non alloy category and into the flat segment we will find a whole variety of products sharing the space right from plates (4.71 mt), HRC (24.11 mt), CRC (8.56 mt), GP/GC (7.74 mt), Pipes (2.1 mt) etc.
Please refer to the table below for details for the year 2016-17
Non Alloy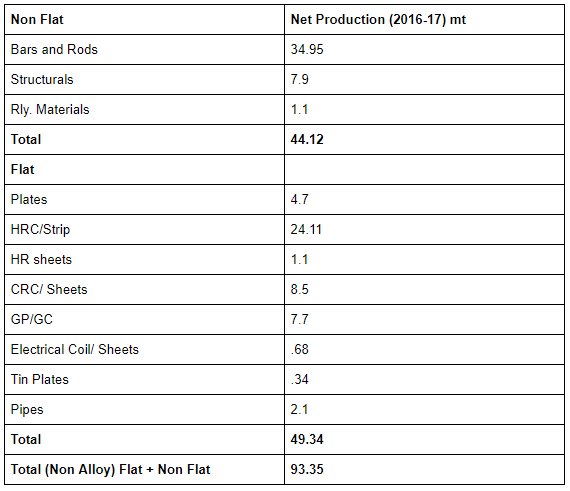
Likewise we have the Alloy category of steel which also has sub categories of flat and non flat and a total production of 8.45 mt including the production of stainless steel which is used in producing utensils and various other sophisticated tools.
The table gives an overview of net production of alloy steel in India in the year 2016-17.
Alloy Steel net production 2016-17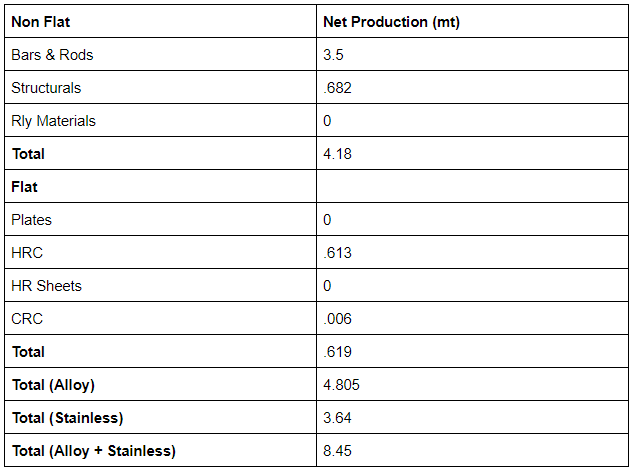
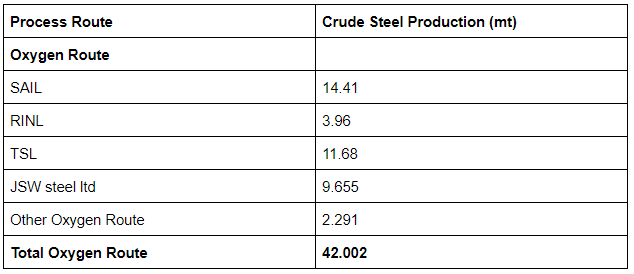
Production Of Steel Route Wise Among Companies
One should keep in mind that large integrated steel players prefer BOF route of producing steel where they start from the very basic raw material that is iron ore and coke and further process it into iron and then into steel by refining it further, large integrated companies prefer this way even though it is capital intensive is because it produces the finest quality of steel and you get into a position to serve large demands. These plants are generally integrated both backward and forward to ensure raw material security in terms of acquiring captive mines for iron ore and coke and also producing finished steel in the form of HRC, TMT etc and not leaving it in mid way in the form of DRI or Pig iron like various other producers. This integration is less complicated as you have little exposure to supply chain issues from third party suppliers.
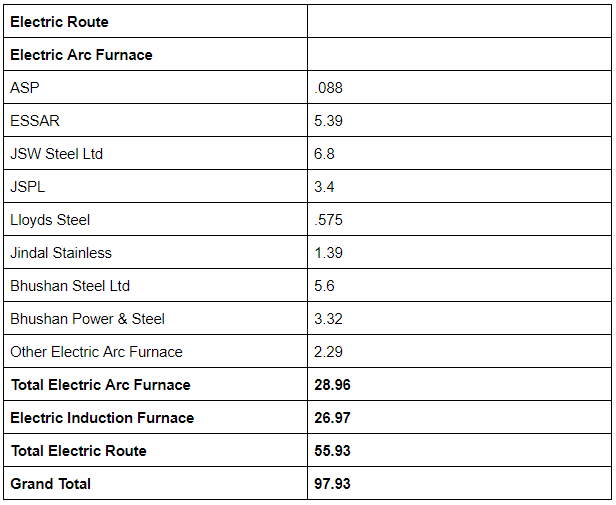
In case of DRI Route or Pig iron, there is one producer of sponge iron who produces sponge iron either through coal based plant or natural gas based plant, then he supplies this sponge iron to various EAF and IF mills where this sponge iron is again melted along with scrap in a furnace and heated with an electrode made of carbon, likewise we continue and produce various grades of steel through EAF/IF route by alloying it with various elements and we get finished steel product in the form of HRC, TMT, CRC etc.
It is quite possible that there is a EAF producer who produces semi finished steel in the form of bloom, billet and slab and leaves it there and sells this semi finished steel to secondary producers in the supply chain which are the hot and cold rolling mills which then produce finished steel which can be used by the industry like autos.
This huge supply chain in the DRI route ends up eating all the profits of not using coking coal unlike BOF route and we find the steel produced through the DRI route equally priced in the market.
The cost of installing the furnaces is low but the long supply chain eats away all the profits.
We Have Put A Table Below Displaying Company Wise Steel Production Breakup-By Technology
Can Plants Run At Capacities Beyond 100%
Yes Steel Plants can sweat themselves more and run at higher capacities and a lot of big integrated steel plants are close to touch 100% capacity utilization as of 2016-17 unlike their smaller counterparts who use DRI technology and they still have to achieve full capacity utilization on the existing capacities.
Very soon India will need additional capacities in the BOF route (SAIL, JSW, JSPL, TSL) and with increase in interest of GOI for building infrastructure across the spectrum, whether it be railways, ports, defense, highways, affordable housing etc, we see the demand for steel to rise in the coming years.
Along with the Government’s push to build infrastructure in the country you will see rising demand for yellow goods and white goods which essentially encompass industrial equipments and heavy machinery and also demand for white goods like refrigerator, microwave ovens and various other appliance will rise as our disposable income rises.
The table below shows the capacity utilization of various plants.
Conclusion
Overall outlook looks positive for the steel sector in general but it is important to follow a bottom-up approach when looking at companies within the sector, one should not lose sight and blindly fall in love with the sector and buy a basket of companies in it, rather we should all perform all necessary due diligence with care on individual businesses which are available at reasonable prices & can make most of the opportunity.
Disclaimer :
The information herein is used as per the available sources of bseindia.com, company’s annual reports & other public database sources. Alpha Invesco is not responsible for any discrepancy in the above-mentioned data. Investors should seek the advice of their independent financial advisor prior to taking any investment decision based on this report or for any necessary explanation of its contents.
Author of the report has investment positions in the stock at the time of publishing this post.
Future estimates mentioned herein are personal opinions & views of the author. For queries/grievances – support@alphainvesco.com or call our support desk at 020-65108952.
SEBI registration No: INA000003106
Readers are responsible for all outcomes arising of buying/selling of particular scrip/scrips mentioned herein. This report indicates the opinion of the author & is not a recommendation to buy or sell securities. Alpha Invesco & its representatives do not have any vested interest in above-mentioned securities at the time of this publication, and none of its directors, associates have any positions / financial interest in the securities mentioned above.
Alpha Invesco or its associates are not paid or compensated at any point of time, or in last 12 months by anyway from the companies mentioned in the report.
Alpha Invesco & its representatives do not have more than 1% of the company’s total shareholding. Company ownership of the stock: No, Served as a director/employee of the mentioned companies in the report: No. Any material conflict of interest at the time of publishing the report: No.
The views expressed in this post accurately reflect the author’s personal views about any and all of the subject securities or issuers; and no part of the compensation, if any was, is or will be, directly or indirectly, related to the specific recommendation or views expressed in the report.
Stay Updated With Our Market Insights.
Our Weekly Newsletter Keeps You Updated On Sectors & Stocks That Our Research Desk Is Currently Reading & Common Sense Approach That Works In Real Investment World.