Optical Fibres – An Introduction
Optical Fibres are long, thin strands made of glass or plastic and have diameter of that of human hair. These optical fibres are used for transmission of data using light pulses between its two ends. Optical fibres are arranged in bundles to form optical fibre cables, which are laid down across the ocean surface for transmission of data across globe.
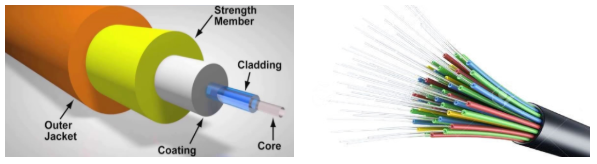
Optical Fibres consist of:
- Core: It is the inner part of the optical fibre carrying light.
- Cladding: This is the outer transparent optical material which surrounds the core reflecting the light back.
- Coating: It is the buffer coating over the cladding that protects the cladding from moisture and physical damage.
- Jacket: It is the outer covering of the cable that protects bundles of optical fibres.
Hundreds / thousands of such optical fibres are arranged in bundles.
Optical Fibres are of 2 types:
-
Single Mode: These Optical Fibres are used for long distance data transmission.
-
Multi Mode: These Optical Fibres are used for short distance data transmission.
Optical Fibre Value Chain
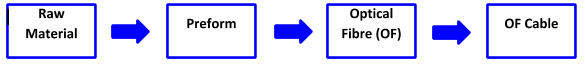
Raw Material:
Major raw material for Optical Fibres is Silicon Dioxide, which is found in sand, gravel, clay, granite, diatomaceous earth, and many other forms of rock. Additionally, minute amounts of other chemicals are also added.
Step 1 – Preform:
A cylindrical preform is made by depositing layers of specially formulated silicon dioxide on the inside surface of a hollow substrate rod. The layers are deposited by applying a gaseous stream of pure oxygen to the substrate rod. The result is a glassy soot, several layers thick, deposited inside the rod. This soot will become the core.
Step 2 – Drawing:
The solid preform is then automatically transferred to a vertical fibre drawing system, leading to optical fibre.
Step 3 – Cabling:
Cabling of the wire is done in this process.
Preform manufacturing is the most technically challenged process and is the highest margin business in the entire value chain. Preform manufacturing earns ~70% of the profits in entire Optical Fibre value chain (Source). Only 10 companies globally have the technology to do it!
Optical Fibre Industry
Optical Fibre Preform
Global Optical Fibre Preform Industry:
Global demand of preform in 2017 was 15,300 tons (i.e. ~450 million kilometres). China accounted for half of the volume, producing ~7,500 tons of preform. Back of envelope conversion to length is that 10,000 tons translates into ~300 million kilometers of preforms. The global Optical Fibre Preform industry size was estimated at USD 2.5 bn in 2018.
Major Global Optical Fibre Preform Manufacturing Companies:
Yangtze Optical Fiber and Cable (YOFC), Corning, Sumitomo Electric Industries, Shin-Etsu Chemical, Fujikura, Prysmian, Furukawa Electric, TwentscheKabel Holding (TKH), Sterlite Tech. Company wise preform capacity is not openly available. However, YOFC has 14.7% share of global preform capacity and Corning has 14.4% share of global preform capacity.
Anti-Dumping by China:
China announced anti-dumping duties on optical fibre preform on 10th July, 2018 for optical fibre preform imported from Japan and United States. This will protect the Chinese optical fibre preform manufacturer and encourage them to invest into more R&D.
Realisation:
Optical Fibre realisation is ~$6-8/km.
Optical Fibre Cable
Global Optical Fibre Cable Industry:
The Global Optical Fibre Cable Industry is valued at USD 7.34 billion in 2019. 5G and IoT will aid the industry to continue to grow in double digits in coming years.
For first time since 2002, 2019 saw a de-growth in optical fibre cable installations. 2019 saw 480 million fibre-km installation v/s 500 million fibre-km installation in 2018, mainly due to demand decrease in China. Also, Indian telecom players cut their capex spending in 2019 owing to their financial problems. India is just 25% fiberized (v/s 60% global avg and US/China being >60% fiberized). Demand in India is totally yet to come. This lead to preform inventory build-up followed by price correction in 2019.
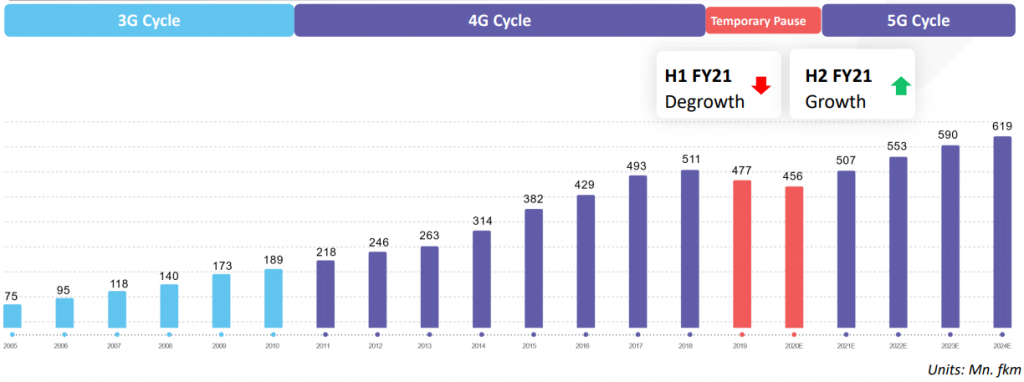
5G Impact:
Below is the chart on Optical Fibre Cable annual consumption during 3G and 4G cycle and potential demand during 5G cycle in coming years.
Indian Optical Fibre Cable Industry:
Indian Optical Fibre Cable Industry is valued at USD 880 million (~12% the size of global industry) in 2019. It is a fast growing industry due to government’s investments towards increasing internet penetration in India with projects like Digital India and Smart Cities. Even Telecom industry and Defence will play a major role in growing the Optical Fibre network in India in coming years.
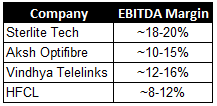
Major Indian companies manufacturing Optical Fibre Cables are Sterlite Technologies Limited, Himachal Futuristic Communications Ltd., Aksh OptiFiber Limited, Finolex Cables Limited, Birla Cables Limited, Vindhya Telelinks Limited, UM Cables Limited, Uniflex Cables Limited, West Coast Optilinks, Paramount Communications Limited, etc.
Sterlite Tech is the only Indian company which currently has the preform manufacturing technology, and hence it generates better margins compared to its peers which manufacture Optical Fibre Cable.
The Optical Fibre and Optical Fibre Preform capacity by Indian players is as following –
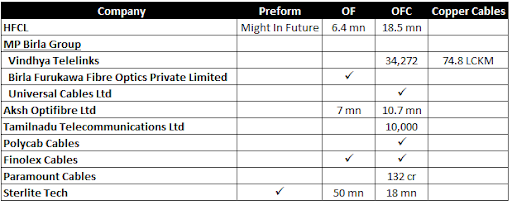
Realisation:
Optical Fibre Cable realisation is ~$15/km.
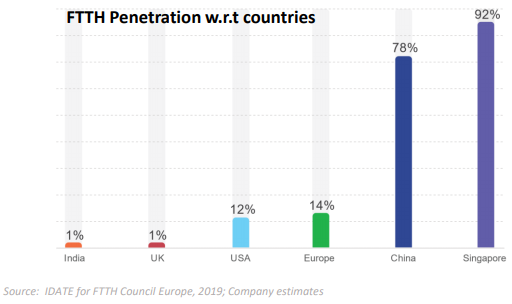
Global penetration in FTTH (Fibre to the home) is very low and has huge potential of growth. Only handful of countries like Singapore and China have higher penetration. COVID19 and work from home is only going to increase the penetration.
Indian Potential:
The US has installed over 400 million km of fibre for less than one-third of Indian population and China has over a billion km of fibre, while India has deployed only about a 100 million km; i.e. just a tenth of what they have achieved. While India deploys only 15 million km of fibre per year, China adds about 150 million km of fibre per year. China installs more optical fibre annually than total installed capacity of India!
Optical Fibre v/s Copper Wire
Optical fibre cables are replacing old copper telecom cables to provide high-speed broadband services. Optical fibre loses only 3% of the signal on distance over 100 meters whereas copper wires lose 94% of the signals. Additionally, optical fibres are more durable compared to copper wires which are easily breakable. Copper wire can be easily tapped, whereas Optical Fibres don’t radiate signals which can be tapped. Also, Optical fibre offers lower latency (the amount of time required to perform data transmission) compared to copper wires.
Disclaimers :
The information herein is used as per the available sources of bseindia.com, company’s annual reports & other public database sources. Alpha Invesco is not responsible for any discrepancy in the above mentioned data. Investors should seek advice of their independent financial advisor prior to taking any investment decision based on this report or for any necessary explanation of its contents
Future estimates mentioned herein are personal opinions & views of the author. For queries / grievances – support@alphainvesco.com or call our support desk at 020-65108952.
SEBI registration No : INA000003106
Readers are responsible for all outcomes arising of buying / selling of particular scrip / scrips mentioned here in. This report indicates opinion of the author & is not a recommendation to buy or sell securities. Alpha Invesco & its representatives do not have any vested interest in above mentioned securities at the time of this publication, and none of its directors, associates have any positions / financial interest in the securities mentioned above.
Alpha Invesco, or it’s associates are not paid or compensated at any point of time, or in last 12 months by any way from the companies mentioned in the report.
Alpha Invesco & it’s representatives do not have more than 1% of the company’s total shareholding. Company ownership of the stock : No, Served as a director / employee of the mentioned companies in the report : No. Any material conflict of interest at the time of publishing the report : No.
The views expressed in this post accurately reflect the authors personal views about any and all of the subject securities or issuers; and no part of the compensations, if any was, is or will be, directly or indirectly, related to the specific recommendation or views expressed in the report.
Stay Updated With Our Market Insights.
Our Weekly Newsletter Keeps You Updated On Sectors & Stocks That Our Research Desk Is Currently Reading & Common Sense Approach That Works In Real Investment World.