Disclaimer: The Blog on US shale oil development is not a recommendation to buy / hold / sell any stock. The published post is for information purpose only. Please read the detailed disclaimer at the bottom of the post.
Overview Of Global Shale Oil Developments
Conventional crude oil production generally refers to the pipe and pump production off a vertical well. This means a hole has been drilled straight down into a deposit and a pump jack is put on it to help pull the deposit to the surface where it can be sent on for further refining
Conventional production establishes the basic costs of drilling a well. You need a rig, drill stem, casing, the crew and all the other pieces that go into a vertical well. The difference between shale oil and normal crude is that instead of drilling just past the target deposit, the well will take a 90 degree in the deposit and runs along it horizontally. These wells go thousands of feet down to reach the deposit, but they also run thousands of feet horizontally. This type of well takes more time to drill, which means higher labour costs and more basic inputs like drill stem.
Shale oil is a substitute for conventional crude oil
Deposits of shale oil / gas are found around the world. US is making the most of Shale gas as they have lots of inhabited land. However, looking at success in US lots of other countries have started to explore their shale reserves. Currently China has the largest Shale reserves followed by Argentina, Algeria and United States
Country wise recoverable reserves:
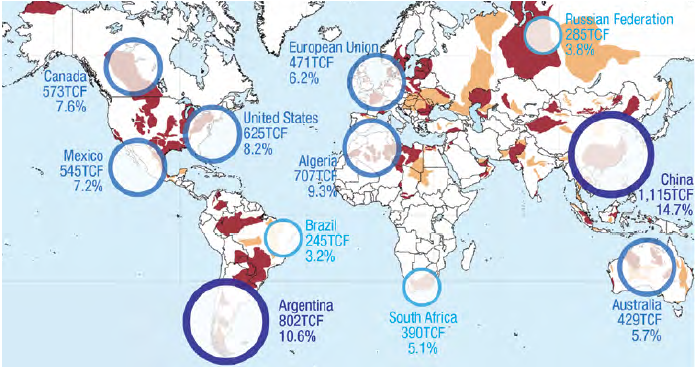
Currently only US and Canada are producing Shale gas at commercial level. China and Argentina are in the early production phase with China being largest potential source. India has very small reserves and have started exploring very recently. Exploration in Middle East doesn’t make sense as any additional reserves will decrease the value of current reserves. Whereas, some countries in Europe have decided to ban production of shale oil & shale gas
Start of Shale Gas Production in the United States :
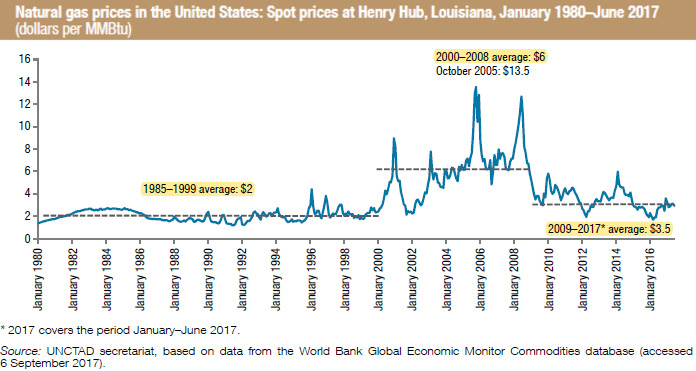
Natural gas prices started to rise at the end of 1990s in the US due to exceptional weather conditions and low inventories. However, later prices softened but yet remained high compared to historical levels (average – $6 MMbtu in 2000-2008 vs. $2 MMbtu in 1985-1999)
The historical high prices of natural gas in 2000–2008 created an opportunity for the development of the large-scale production of shale gas in the United States. Natural gas gross extraction from shale gas wells almost tripled in 2007–2010. However, the combination of large quantities of natural gas becoming available and declining demand owing to the financial and economic crisis in 2008 led to an oversupply situation and a significant fall in natural gas prices starting from mid-2008
However, the sharp downward trend in natural gas prices in the United States did not lead to a significant and immediate reaction with regards to production as Most producers expected the declining trend of natural gas prices to be temporary and also due to long-term engagements of shale gas producers with drilling and fracturing companies, as well as conditions of minimum production enshrined in exploration and production permits in the United States, shale gas producing companies had to continue to drill, whatever the price on the market
Marginal cost of shale gas production in the United States is considered to be around $4 per MMbtu (Forbes, 2017). A barrel of crude oil is equivalent to 5.8 MMbtu of gas
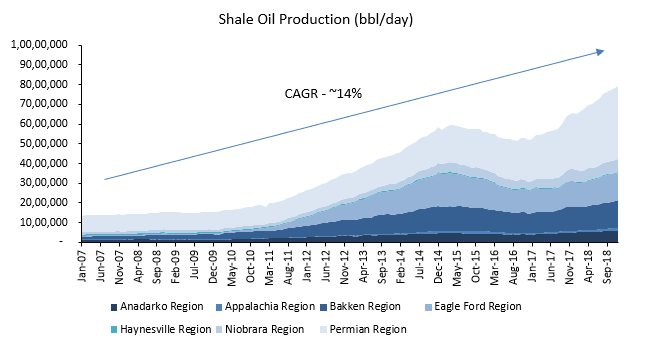
US Shale Oil Production :
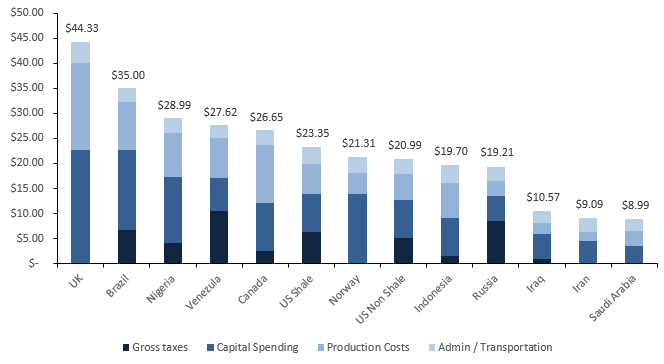
Cost of Production of Various Countries:
As per WSJ – Average cash cost to produce a barrel of oil or gas equivalent in 2016, based on data from March 2016.
US Oil Breakeven Prices :
As per consulting firm R.S. Energy Group, the breakeven prices excluding the land costs and overhead is at about $37 for the Permian Basin of West Texas and New Mexico, $42 for the Eagle Ford in South Texas and $47 for the Bakken in North Dakota. But companies require much higher oil prices if all prices are considered. All inclusive break-evens are about $51 in the Permian, $57 in the Eagle Ford and $64 in the Bakken
The biggest 30 shale operators have seen lower profitable margins with oil prices at average of $50 per barrel in 2017

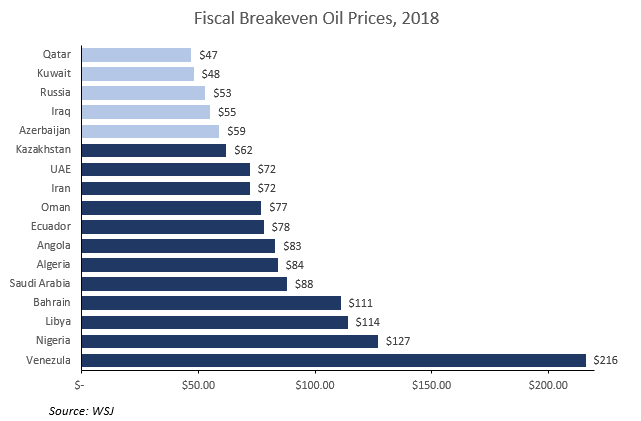
OPEC Fiscal Breakeven Prices To Balance Their Budgets :
Economies of OPEC is dependent on their oil exports and oil prices. So, management of oil prices for OPEC countries is very important. With Brent crude prices around $60 per barrel, oil prices are below levels many OPEC and allied nations need to balance their budgets
Disclaimers :
The information herein is used as per the available sources of bseindia.com, company’s annual reports & other public database sources. Alpha Invesco is not responsible for any discrepancy in the above mentioned data. Investors should seek advice of their independent financial advisor prior to taking any investment decision based on this report or for any necessary explanation of its contents
Future estimates mentioned herein are personal opinions & views of the author. For queries / grievances – support@alphainvesco.com or call our support desk at 020-65108952.
SEBI registration No : INA000003106
Readers are responsible for all outcomes arising of buying / selling of particular scrip / scrips mentioned here in. This report indicates opinion of the author & is not a recommendation to buy or sell securities. Alpha Invesco & its representatives do not have any vested interest in above mentioned securities at the time of this publication, and none of its directors, associates have any positions / financial interest in the securities mentioned above.
Alpha Invesco, or it’s associates are not paid or compensated at any point of time, or in last 12 months by any way from the companies mentioned in the report.
Alpha Invesco & it’s representatives do not have more than 1% of the company’s total shareholding. Company ownership of the stock : No, Served as a director / employee of the mentioned companies in the report : No. Any material conflict of interest at the time of publishing the report : No.
The views expressed in this post accurately reflect the authors personal views about any and all of the subject securities or issuers; and no part of the compensations, if any was, is or will be, directly or indirectly, related to the specific recommendation or views expressed in the report.
Stay Updated With Our Market Insights.
Our Weekly Newsletter Keeps You Updated On Sectors & Stocks That Our Research Desk Is Currently Reading & Common Sense Approach That Works In Real Investment World.