Disclaimer: The Blog on ‘Financial Shenanigans’ is not a recommendation to buy / hold / sell any stock. The published post is for information purpose only. Please read the detailed disclaimer at the bottom of the post.
Financial Shenanigans – How A Management Can Mislead Its Investors About A Company’s Financial Performance Or Economic Health By Using Few Accounting / Financial Reporting Tricks – Part 1
Below series of articles is summary of the book – Financial Shenanigans written by Howard M. Schilit. All the accounting / reporting standards in the series of articles are as per US GAAP which might vary a little compared to accounting standards used in India i.e. Ind AS.
About The Author – Howard M. Schilit.
Back in 1994, Dr. Schilit founded an institutional independent research advisory organization, the Center for Financial Research and Analysis (CFRA), to warn investors about corporate financial reporting improprieties and train clients to incorporate his research process into their analyses. After a decade of leading CFRA, Dr. Schilit sold a majority stake to a private equity firm, TA Associates, and retired as president and chief executive. Previously, Dr. Schilit taught accounting at Washington, D.C.– based American University for 17 years.
What Are Financial Shenanigans?
Financial shenanigans are actions taken by management that mislead investors about a company’s financial performance or economic health. As a result, investors are often tricked into believing that a company’s earnings are stronger, its cash flows more robust, and its Balance Sheet position more secure than are really the case.
Some shenanigans can be detected in the numbers presented by carefully reading a company’s Balance Sheet, Statement of Income, and Statement of Cash Flows. Proof of other shenanigans might not be explicitly provided in the numbers and therefore requires scrutinizing the narratives contained in footnotes, quarterly earnings releases, and other publicly available representation by management. The book classifies financial shenanigans into three broad categories: Earnings Manipulation Shenanigans, Cash Flow Shenanigans, and Key Metrics Shenanigans.
Before we dig deeper into particular shenanigans, to understand the context of the book – let’s salute few managements who were so creative with their accounting tricks that lead their companies into bankruptcy and cost its investors almost everything.
Enron: Most Imaginative Fabrication of Revenue (Financial Shenanigans)
Houston based Enron Corp. quickly became synonymous with the term massive accounting fraud in the fall of 2001 with its sudden collapse and bankruptcy. Many people have described the utility company’s ruse as a cleverly designed fraud involving the use of thousands of off-balance-sheet partnerships to hide massive losses and unimaginable debts from investors. While that story line is essentially correct, detection of red flags required no special accounting skills or even advanced training in reading financial statements. It simply required the curiosity to notice and question a stupendous five-year jump in Enron’s sales revenue from 1995 to 2000.

Enron’s revenue went up more than 10 times in just 5 years from $9bn to $100bn whereas, its net profit was hardly doubled (in 2000 vs. 1995).
Clearly something was wrong as it took Walmart – 10 years to go from a revenue of $10bn to $100bn, 31 years to General Motors, 27 years for Ford and 17 Years for ExxonMobil but Enron did it in just 5 years.
Enron had several off-balance sheet partnerships through which they raised huge amounts of debt and purchased goods from the holding company. This not only boosted their revenue but also helped Enron in reporting lower debt as it did not consolidate these partnerships on its balance sheet. In October 2001, Enron’s auditor Arthur Andersen concluded that some of these partnerships should have been consolidated followed by Enron later restating its financials (took a $1.2bn reduction in its stockholders’ equity). In early December 2001, Enron filed for bankruptcy with assets of ~$65bn.
It was the largest corporate bankruptcy in U.S. history (until WorldCom declared bankruptcy seven years later followed by Lehman Brothers in 2008).
Enron’s chairman and former CEO, Ken Lay, and other top officials sold hundreds of millions of dollars worth of stock in the months leading up to the crisis.
WorldCom: Most Brazen Creation of Fictitious Profit and Cash Flow (financial shenanigans)
WorldCom consistently used aggressive accounting practices to inflate its earnings and operating cash flows. One of its principal shenanigans involved making acquisitions, writing off much of the costs immediately, creating reserves, and then releasing those reserves into income as needed. With more than 70 deals over the company’s short life, WorldCom continued to reload its reserves so that they were available for future release into earnings.
This shenanigan would probably have been able to continue had WorldCom been allowed to acquire the much larger Sprint in a $129 billion deal announced in October 1999. Antitrust lawyers and regulators at the U.S. Department of Justice and their counterparts at the European Union disapproved of the merger, citing monopoly concerns. Without the acquisition, WorldCom lost the expected infusion of new reserves that it needed, as its prior ones had rapidly been depleted by being released into income.
By early 2000, with its stock price declining and intense pressure from Wall Street to make its numbers, WorldCom embarked on a new and far more aggressive shenanigan—moving ordinary business expenses from its Income Statement to its Balance Sheet. One of WorldCom’s major operating expenses was its so-called line costs. These costs represented fees that WorldCom paid to third party telecommunication network providers for the right to lease their networks. Accounting rules clearly require that such fees be expensed and not be capitalized. This trick continued quarter after quarter from mid-2000 through early 2002 until it was uncovered by internal auditors at WorldCom. The company’s CFO was immediately fired as internal auditors found $3.8bn in inappropriate accounting entries.
On July 21, 2002, the company filed for Chapter 11 bankruptcy protection, the largest such filing in U.S. history at that time (a record that has since been overtaken by the collapse of Lehman Brothers in September 2008). Under the bankruptcy reorganization agreement, the company paid a $750 million fine to the SEC and restated its earnings in an amount that defies belief. In total, the company reported an accounting restatement that exceeded $70 billion, including adjusting the 2000 and 2001 numbers from the originally reported gain of nearly $10 billion to an astounding loss of over $64 billion. The directors also felt the pain, having to pay almost $25 million to settle class-action litigation.
Investors would have found some clear warning signs in evaluating WorldCom’s Statement of Cash Flows (SCF), specifically, its rapidly deteriorating free cash flow. WorldCom manipulated both its net earnings and its operating cash flow.
By treating line costs as an asset instead of an expense, WorldCom improperly inflate its profits. In addition, since it improperly placed those expenditures in the Investing rather than the Operating section of the SCF, WorldCom similarly inflated operating cash flow. While reported operating cash flow appeared consistent with reported earnings, the company’s free cash flow told the story.

Tyco: Most Shameless Heist by Senior Management (Financial Shenanigans)
Similar to WorldCom, Tyco International Ltd. loved doing acquisitions – from 1999 to 2002,
Tyco bought more than 700 companies for a combined total of approximately $29 billion.
While some of the acquired companies were large businesses, many were so small that Tyco did not even bother disclosing them to investors in its financial statements. However, what Tyco seemed to like about these acquisitions was the accounting loopholes that they presented. The acquisitions allowed the company to reload its dwindling reserves, providing a consistent source of artificial earnings boosts. Moreover, the frequent acquisitions allowed Tyco to show strong operating cash flow, even though it merely resulted from an accounting loophole. Indeed, Tyco loved the acquisition accounting benefits so much that it even used them when no acquisitions at all occurred.
Consider how Tyco accounted for payments that it made in soliciting new security-alarm business in its ADT subsidiary. Rather than hire additional employees, Tyco decided to use an independent network of dealers to solicit new customers. Tyco was so enamoured with acquisition accounting that it decided to use this technique to record the purchase of these contracts from agents. In so doing, Tyco inflated its profits by failing to record the proper expense. Moreover, Tyco inflated its operating cash flow by recording these payments in the Investing section of the Statement of Cash Flows. But Tyco had many more tricks up its sleeve. It increased the price paid to dealers for each contract, and in return, required the dealers to pay that increased amount back to it as a connection fee for doing business. While this arrangement clearly had no impact on the underlying economics of the transaction, Tyco inappropriately decided to record this connection fee as income, providing an artificial boost to both earnings and operating cash flow.
Tyco used inappropriate accounting for ADT contract purchases to fraudulently generate $567 million in operating income and $719 million in cash flow from operations. Moreover, the SEC charged that Tyco engaged in improper acquisition accounting practices that inflated operating income by at least $500 million.
Not only that senior executives (mainly CEO Dennis Kozlowski and CFO Mark Swartz) had been using the company’s cash account as their own piggy bank. The government charged that these executives had been stealing hundreds of millions of dollars from Tyco by failing to properly disclose to shareholders the existence of back-door executive compensation arrangements and related-party transactions. With the board unaware or asleep at the wheel, senior executives granted themselves loans for personal expenses, many of which were secretly forgiven, effectively producing a large unreported compensation expense.
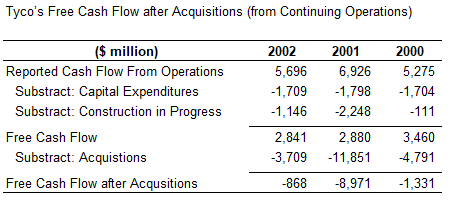
Detailed cash flow analysis would have helped investors notice problems at Tyco. By adjusting the free cash flow calculation for acquisitions, investors would have a clearer picture of a company’s performance.
Acquisitions present numerous opportunities for companies to inflate earnings and both operating and free cash flow. In the case of Tyco, big drops in adjusted free cash flow were witnessed.
Symbol Technologies: Most Ardent and Prolific Use of Numerous Financial Shenanigans
Although much smaller in size, Long Island–based Symbol Technologies Inc., a maker of bar code scanners, was most innovative in terms of fooling its investors.
Symbol seemed to be obsessed with never disappointing Wall Street. For more than eight consecutive years, it either met or exceeded Wall Street’s estimated earnings—32 straight quarters of sustained success.
In hindsight, though, such steady and predictable performance (particularly during the technology collapse of 2000–2002) should have alerted investors to take a closer look.
Symbol never wanted its earnings to get too high or too low, so it would record bogus adjustments to the company’s financial statements at the end of each quarter in order to align its results with Wall Street expectations. In very strong periods, for example, the company would take charges to create cookie jar reserves that could be used to boost earnings during weaker periods. That occurred in the late 1990s when Symbol won a large contract from the U.S. Postal Service that accounted for 11% of the company’s 1998 revenue. Symbol cleverly used restructuring charges to dampen its reported growth, and in so doing, both lowered the bar to meet future-period Wall Street expectations and created reserves that could be released when needed.
If, instead, Symbol’s business slowed and Wall Street targets went unmet, the company would stuff the channel, or ship products to customers too early in order to record additional revenue. Symbol also allegedly inflated revenue by shipping products that its customers did not want. The company even sold products to customers in order to record revenue, then repurchased the goods at a higher price (a bizarre arrangement in which Symbol actually lost money in order to create revenue growth).
Moreover, if Symbol’s operating expenses got out of control and needed some trimming, there was a ready solution. In one case, when paying bonuses in early 2001, Symbol conveniently (and improperly) deferred the related Federal Insurance Contributions Act (FICA) insurance costs, thereby inflating operating income. The company also tidied up messy issues that surfaced on the Balance Sheet, like accounts receivable that were not getting collected.
In 2001, Symbol was concerned that Wall Street would react unfavourably to surging receivables, so it simply moved them to another section of the Balance Sheet where they would be hidden from investors.
The regulators finally caught up with Symbol after all those years of duping investors. The SEC accused Symbol of perpetrating a massive fraud from 1998 until 2003. After being indicted on securities fraud charges, CEO Tomo Razmilovic fled the country and was declared a fugitive. He even made the U.S. Postal Inspection Service’s most-wanted list, with a $100,000 reward offered for his arrest and conviction. He is still on the lam, apparently living comfortably in Sweden.
Forensic research firm, the Center for Financial Research and Analysis (CFRA, and now part of RiskMetrics Group), issued six separate reports between 1999 and 2001, warning investors about Symbol’s aggressive accounting practices. Specific issues raised in our reports include the following:
- Unusually large one-time charges seemed to be designed to create bogus reserves that could be used in future periods to benefit earnings. For example, when acquiring Telxon in 2000, Symbol wrote off 68% of the purchase price. Symbol also wrote off inventory that may have subsequently been sold, providing a boost to margins.
- Symbol showed signs of aggressive cost capitalization, including a doubling of capitalized software and a surge in soft assets to 21% of total assets in Q2 2000 (from 11% the prior year).
- Accounts receivable surged from early 1999 to 2001, signalling aggressive revenue recognition.
- Symbol’s allowance for doubtful accounts continuously declined as a%age of accounts receivable, providing a benefit to earnings.
- Symbol frequently fell half a penny short of earnings per share (EPS) targets but kept its Wall Street success streak alive by rounding up (for example, rounding up $0.1167 to achieve the target of $0.12).
- Cash flow from operations routinely lagged behind net income, a sign of poor earnings quality.
Many investors in Enron, WorldCom, Tyco, and Symbol Technologies paid heavy prices for failing to spot early signs of operating problems that had been camouflaged by financial shenanigans. Fortunately, investors, auditors, and other stakeholders can learn lessons from these debacles and better arm themselves with the knowledge of how to detect similar warning signs in the future.
The next set of articles go deep into specific shenanigans and suggests how skeptical investors can ferret out these tricks to avoid losses.
Disclaimers :
The information herein is used as per the available sources of bseindia.com, company’s annual reports & other public database sources. Alpha Invesco is not responsible for any discrepancy in the above mentioned data. Investors should seek advice of their independent financial advisor prior to taking any investment decision based on this report or for any necessary explanation of its contents
Future estimates mentioned herein are personal opinions & views of the author. For queries / grievances – support@alphainvesco.com or call our support desk at 020-65108952.
SEBI registration No : INA000003106
Readers are responsible for all outcomes arising of buying / selling of particular scrip / scrips mentioned here in. This report indicates opinion of the author & is not a recommendation to buy or sell securities. Alpha Invesco & its representatives do not have any vested interest in above mentioned securities at the time of this publication, and none of its directors, associates have any positions / financial interest in the securities mentioned above.
Alpha Invesco, or it’s associates are not paid or compensated at any point of time, or in last 12 months by any way from the companies mentioned in the report.
Alpha Invesco & it’s representatives do not have more than 1% of the company’s total shareholding. Company ownership of the stock : No, Served as a director / employee of the mentioned companies in the report : No. Any material conflict of interest at the time of publishing the report : No.
The views expressed in this post accurately reflect the authors personal views about any and all of the subject securities or issuers; and no part of the compensations, if any was, is or will be, directly or indirectly, related to the specific recommendation or views expressed in the report.
Stay Updated With Our Market Insights.
Our Weekly Newsletter Keeps You Updated On Sectors & Stocks That Our Research Desk Is Currently Reading & Common Sense Approach That Works In Real Investment World.