Indian Tyre Industry
The Indian Tyre Industry is an integral part of the Auto Sector – It contributes to ~3% of the manufacturing GDP of India and ~0.5% of the total GDP directly. So, let’s understand the dynamics of the Tyre Industry in India.
Indian tyre industry has almost doubled from ~Rs 30,000 crores in 2010-11 to ~Rs 59,500 crores in 2017-18 of which 90-95% came from the domestic markets. The top three companies – MRF, Apollo Tyres and JK Tyres have ~60% of the market share in terms of revenue. In terms of segmentation tyres can be divided in two ways – based on end market and based on product.
Based On End Market
Replacement, OEMs & Exports
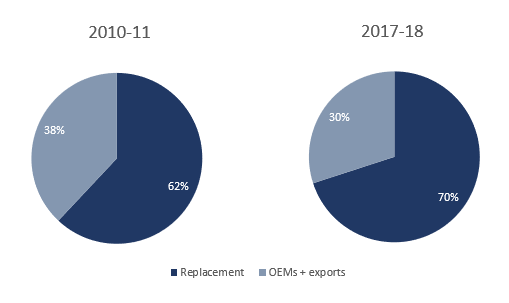
Indian tyre market is clearly skewed towards the replacement segment which contributes ~70% of total revenues. Whereas in volume (tonnage) terms the replacement segment contributes ~60% indicating realizations in the after-market are clearly higher than OEMs (Original Equipment Manufacturer) market
Based On Products
Truck & Bus (T&B), Passenger Vehicle (PV), 2/3-Wheeler, Off-Highway Tyres (OHT) & Others
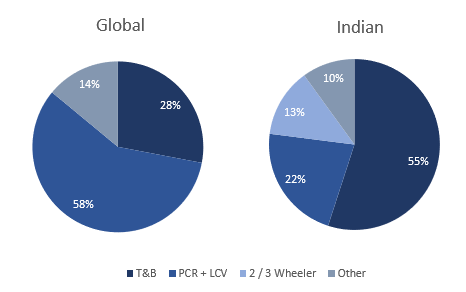
T&B tyres in India generates the major revenue i.e. 55% of total revenue whereas globally it’s the PCR (Passenger Car Radials) contribute the largest portion of the revenue. This is mainly because of very low penetration of passenger vehicles in India – below 20 per 1,000 people whereas in China the number is ~69 per 1,000 people and 786 per 1,000 people in US. In terms of volume (tonnage) T&B contributes around ~50% of the total volume
The demand from OEM’s is widely spread across the segment where T&B contributed ~35% and PVs & 2/3 Wheeler’s contributed ~25% & ~22% respectively. In term of the replacement segment the demand was more skewed towards the T&B tyres which contributed ~61% and PVs & 2/3 Wheeler’s contributed ~14% & ~9% respectively.
Disclaimer: The post on Indian Tyre Industry is not a recommendation to buy / hold / sell any stock mentioned in the post. The published post is for information purpose only. The intention to share write ups on this blog is to create a repository of ideas so that investors can have a look at various frameworks & approaches. Please read the detailed disclaimer at the bottom of the post.
Manufacturing Process :
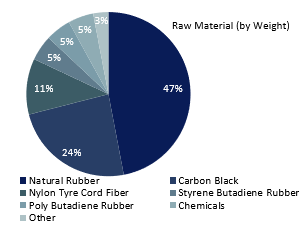
A simple round looking tyre is manufactured by complex assembly of more than 250 raw materials amongst which the major components include natural & synthetic rubber, nylon tire fabric, bead wire, carbon black, reinforcing non-black fillers like silica, vulcanizing agents & anti-oxidants.
The process begins with the mixing of basic rubbers with process oils, carbon black, pigments, antioxidants, accelerators and other additives, each of which contributes certain properties to the compound.
These ingredients are mixed in giant blenders called Banbury machines operating under high heat and pressure. They blend the many ingredients together into homogenized batch of black material with the consistency of gum. The mixing process is computer-controlled to assure uniformity. The compounded materials are then sent to the next stage of processing for further processing into sidewalls, treads or other parts of the tyre.
Then the task of assembling the tyre begins. The first component to go on the tyre building machine is the inner liner, a special rubber that is resistant to air and moisture penetration and takes the place of an inner tube. Next comes the body plies and belts, which are often made from polyester and steel – Plies and belts give the tyre strength while also providing flexibility. The belts are cut to the precise angle and size specified by the tyre engineer to provide the desired ride and handling characteristics.
Bronze-coated strands of steel wire, fashioned into two hoops, are implanted into the sidewall of the tyres to form the bead, which assures an airtight fit with the rim of the wheel. The strands are aligned into a ribbon coated with rubber for adhesion, then wound into loops that are then wrapped together to secure them until they are assembled with the rest of the tyre.
Radial tyres are built on one or two tyre machines. The tyre starts with a double layer of synthetic gum rubber called an inner liner that will seal in air and make the tyre tubeless.
Then, come two layers of ply fabric, the cords – two strips called apexes stiffen the area just above the bead. Next, a pair of chafer strips is added to resist the chafing from the wheel rim when mounted on a car.
The tyre building machine pre-shapes radial tyres into a form which is very close to their final dimension to check whether components are placed in proper position before the tyre goes into the mold.
Now the tyre builder adds the steel belts that resist punctures and hold the tread firmly against the road. The tread is the last part to go on the tyre and is pressed firmly together by automatic rollers. The end result is called a “green” or uncured tyre, ready for inspection and curing.
The curing press is where tyres get their final shape and tread pattern. Hot molds like giant waffle irons shape and vulcanize the tyre. The molds are engraved with the tread pattern, the sidewall markings of the manufacturer.
Tyres are cured at over 300 degrees for 12 to 25 minutes, depending on their size. As the press swings open, the tyres are ejected from their molds onto a long conveyor belt that carries them to final finish and inspection bay.
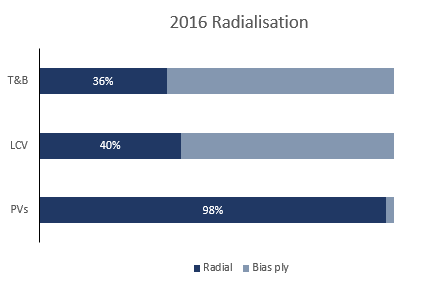
However, technologically there are two types of tyres one is the radial tyre and the other is biased ply :
Radial Tyres :
To increase structural integrity, radial tyres are constructed with perpendicular polyester plies and crisscrossing steel belts underneath the tread. This construction provides a smooth ride and extends the life of the tyre. Radial tyres are generally used for long-haul towing, travel trailers, toy haulers, larger boats and livestock.
Bias Tyres :
A bias tyre’s construction consists of internally crisscrossing nylon cord plies at a 30 to 45-degree angle to the tread center line. This design gives the tire a tough and rugged build and increases sidewall puncture resistance. Bias technology is generally used for construction, agriculture, marine and utility applications.
Radial tyre generally cost 20-25% higher compared to Bias tyres however, as larger amount of steel is required the cost of manufacturing also slightly increases and it also increases the wear n tear of the tyre.
Radialisation of T&B & LCV tyres has improved over last two years and is expected to improve further as commercial vehicle OEMs have started using radial technology.
Cost Structure :
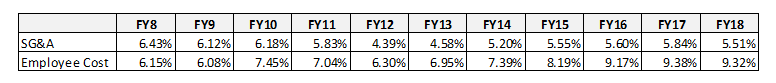
Tyre Industry is known for its capital-intensive structure where 60% to 65% of the revenues is raw material cost. The other important cost involved are SG&A (selling general & administrative) which roughly contribute from 6% to 12% of the revenues and employee cost contributing from 7% to 14% of revenues.
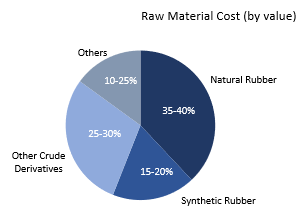
Raw Material Costs :
As we saw above that around 250 different raw material are put together to manufacture a tyre but the major cost generating raw materials are natural rubber, synthetic rubber and crude derivatives like carbon black which contribute to ~80% to 85% of the total raw material cost. Hence, rubber and crude price are key variable to tyre company’s profitability
Historical average gross margins vs rubber & crude prices :
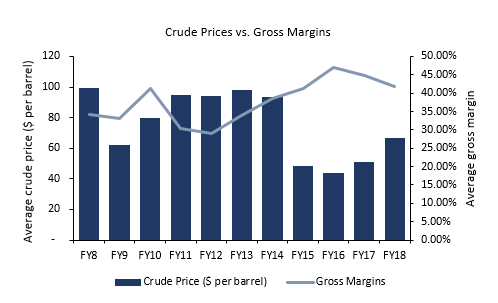
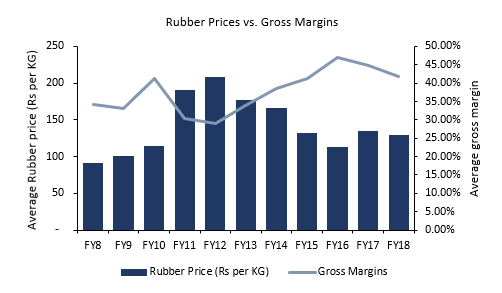
The Indian tyre industry has been under raw material pressure for last two year due to increase in rubber and crude prices which can be clearly seen in the above comparison charts. As per the managements the pressure on the raw materials is expected to continue in the shorter term due to increasing crude prices
Average SG&A & Employee cost (% of revenue):
A Quick Glance At A Few Indian Tyre Companies :
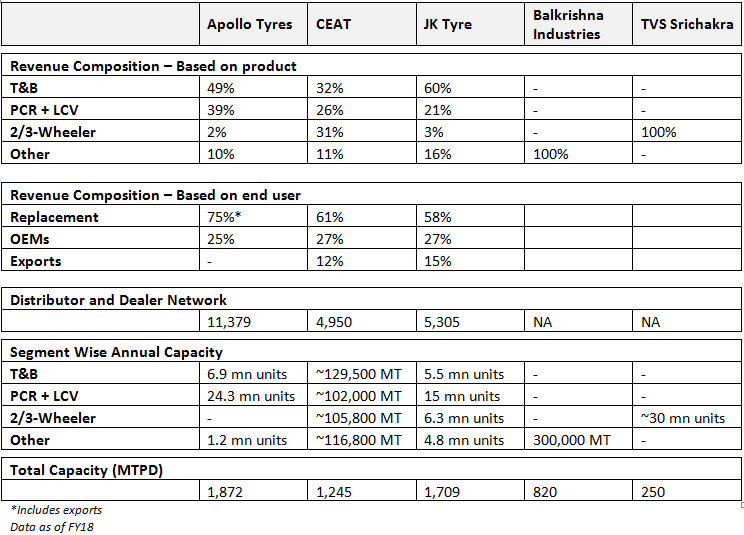
Capacity Expansion Plans :
The Indian tyre industry is expected to see significant capacity expansion in the upcoming two to three years. All major players in the industry have announced their plans
MRF :
MRF has announced to set up a new facility in Gujarat where it plans to spend ~Rs 4,500 crores over next few years
Apollo Tyres :
Apollo tyres laid foundation for their fifth Indian facility in Andhra Pradesh which they will manufacture passenger vehicle tyres. The company is spending ~Rs 1800 crores in the first phase of the project. The facility is expected to commence operation in two years from now. Apollo is also planning to expand its T&B capacity at the Chennai plant which is expected to commence operations in this financial year
JK Tyres :
In 2016, JK Tyres acquired the Cavendish tyre business from the BK Birla group to enter in the two-wheeler segment. JK Tyre now plans to expand its T&B tyre capacity by ~0.6 mn units at the Cavendish facility by investing ~Rs 275 crores
CEAT :
CEAT has announced a capex of ~Rs 3,000 to 4,000 crores over next 4 to 5 years. The company is entering into the OHT (off-highway tyre) segment with a new facility in the Amber Nath. The company has started its operations at a very small scale and plans to expand it further to capacity of ~100 MTPD. CEAT is also planning to expand its capacity significantly PCR with a greenfield expansion in Chennai which Is expected to come online in line with Apollo’s Andhra greenfield facility. It also has plans to expand it T&B and 2/3-Wheeler capacity by brown field expansion at Halol and Nagpur plant
Balkrishna Industries :
Balkrishna Industries is coming up with an additional greenfield facility in the US with a capex of $100 mn (~Rs 700 crores) which will manufacture 20,000 tonnes of OHT tyres every year. The company is also spending ~Rs 500 crores in its domestic Waluj plant which will generate incremental capacity of 5,000 tonnes every year. Balkrishna also plans to set up a 140,000 tonnes/year carbon black facility
Bridgestone :
Bridgestone India is planning to spend ~$304 mn to increase its current capacity of 15,000 tyres per day to 41,000 tyres per day
Looking at the above expansion plans it seems there could be a competitive scenario amongst the tyre companies to gain market share as majority of the capacities have similar timelines. The tyre companies might grow at a decent pace by selling more tyres however, their margins and return ratios might take a hit in order to achieve market share
Important Financial Metrics To Look At :
We believe the most important metric while comparing / analyzing a commodity business is its unit level economies, well tyre is no different. As different tyre companies manufacture different type of tyres it is very difficult to compare realizations of one tyre company with other. The solution could be comparing them on per ton basis
- Realizations per ton (Net operational sales/tons sold) : Comparing realization per ton could help us understand which company can sell its products at premium compare to other tyre companies. Looking at realization per ton over time could also help us understand the pricing trend of the companies
- Cost per ton (COGS/tons sold) : Cost per ton could help us understand which company is efficiently using its raw material
- EBITDA per ton (EBITDA/tons sold) : EBITDA per ton could help us understand which company has been operationally more efficient (higher the better)
Opportunities :
Auto Industry
Tyre industry is integral part of auto industry. OEM tyre demand is directly related to auto production. As per automotive mission plan 2026 (AMP 2026) the Indian automotive industry is expected to grow 3.5 to 4 times in value from its output of Rs 4.64 lakh crores in 2015 to Rs 16.16 to 18.88 lakh crores in 2026 with an average growth rate of 6%

Read more about AMP2026 – Link
The passenger vehicle and commercial vehicle sales are expected to grow due to increasing vehicle penetration due to improvement of per capita income in the country
Concerns :
Raw Material
As mentioned above tyre industry is raw material intensive and India majorly depends on imports as the demand for raw materials like rubber, crude & carbon black is more than supply by the domestic. manufactures
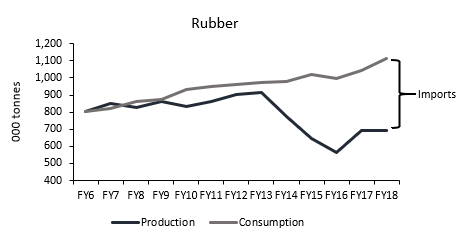
In FY18, India produced ~694,000 tonnes and consumed ~1,112,000 tonnes of rubber whereas, the gap was fulfilled by imports. India almost imported ~470,000 tonnes of rubber. Rubber imports in India attract a duty of 25% or Rs 30 per KG whichever is lower increasing input costs further
India has sufficient capacities of carbon black. However due to increasing exports of carbon black the demand-supply gap has increased in last two years leading to import of carbon black.
Inability To Pass Price Rise To OEMs
The ability to pass on sharp rises in raw material prices to OEMs remains a challenge for industry players. Generally, many tyre manufacturers are unable to pass on higher raw material prices to OEMs, due to bulk demand fearing loss of market share.
Rising Interest Rates
As many players in the tyre industry have plans to further expand their capacities which will be partly funded by debt. As RBI has been recently increasing interest rates due to macro issues. The expected increase in rate could lead to increase in finance costs of the companies.
Global Trend :
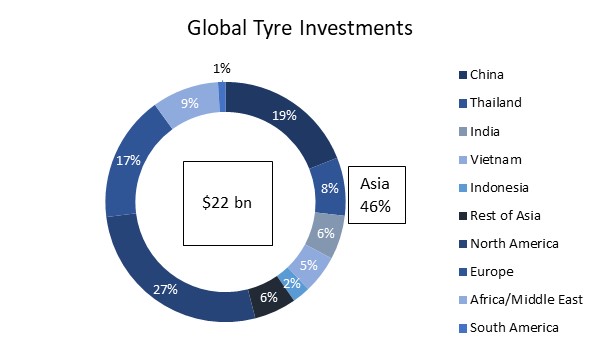
The global tyre industry has been witnessing a shift in the tyre manufacturing activity, with Asia carving a much larger piece of the pie with regard to the number of plants. Almost 60% of the global tyre plants are located in Asia today
Globally, ~$22 billion worth of investment have been planned between 2016-2021. Asia account for the majority share with ~46% of the total investments. Overall Asian economies accounted for ~50% of the global sales and China is the world largest tyre market
Among the advanced economies, the US tyre industry, both replacement market and OEM segment has seen muted growth. Passenger car and light truck markets have witnessed a decline in both segments. However, the medium and heavy truck tyre market has seen a rising demand across both segments
The European tyre industry continues to register improving growth. Germany, the UK, France, Italy, Spain and Poland are the major markets that contribute to more than 60% of the total Europe tyre sales in terms of volume
In 2017, the global passenger car tyre demand grew by an estimated 2.7%. The OEM demand sustained globally, except North America. The replacement tyre segment grew by estimated 3% with most of the growth coming from Europe, Asia and South America
The global truck and bus tyre segment witnessed strong demand from OEM segment. Asia observed increased sales of estimated 26% in the segment with most of the growth coming from China (~30% Y-o-Y). The demand in North America grew by an estimated 10%, while Europe recorded a growth of 8%. Globally, replacement demand had muted growth, with most of the demand coming from North America and Europe, while Asia observed almost stagnant growth.
Subscribe to our WhatsApp and receive updates directly:

Disclaimers :
The information herein is used as per the available sources of bseindia.com, company’s annual reports & other public database sources. Alpha Invesco is not responsible for any discrepancy in the above mentioned data. Investors should seek advice of their independent financial advisor prior to taking any investment decision based on this report or for any necessary explanation of its contents.
Future estimates mentioned herein are personal opinions & views of the author. For queries / grievances – support@alphainvesco.com or call our support desk at 020-65108952.
SEBI registration No : INA000003106
Readers are responsible for all outcomes arising of buying / selling of particular scrip / scrips mentioned here in. This report indicates opinion of the author & is not a recommendation to buy or sell securities. Alpha Invesco & its representatives do not have any vested interest in above mentioned securities at the time of this publication, and none of its directors, associates have any positions / financial interest in the securities mentioned above.
Alpha Invesco, or it’s associates are not paid or compensated at any point of time, or in last 12 months by any way from the companies mentioned in the report.
Alpha Invesco & it’s representatives do not have more than 1% of the company’s total shareholding. Company ownership of the stock : No, Served as a director / employee of the mentioned companies in the report : No. Any material conflict of interest at the time of publishing the report : No.
The views expressed in this post accurately reflect the authors personal views about any and all of the subject securities or issuers; and no part of the compensations, if any was, is or will be, directly or indirectly, related to the specific recommendation or views expressed in the report.
Stay Updated With Our Market Insights.
Our Weekly Newsletter Keeps You Updated On Sectors & Stocks That Our Research Desk Is Currently Reading & Common Sense Approach That Works In Real Investment World.