Earnings yield (trailing basis) has started to converge to 10 year bond yields and nobody is noticing. People are banging heads on the PEs of SENSEX while EPs are telling a different story.
Bond Yield and Stock Market:
We all know that stock markets and fixed income markets compete for investors’ money and investors employ yields to base their judgement to choose either of the two.
For example, if you have a market with a PE of 20, most folks would say that it seems ‘high’, how do you think about 5% earnings yield? If bond interest rates are 8%, the 5% earnings yield may not be attractive, but if bonds interest rates are 3% it could be attractive.
Earnings Yield vs Bond Yield
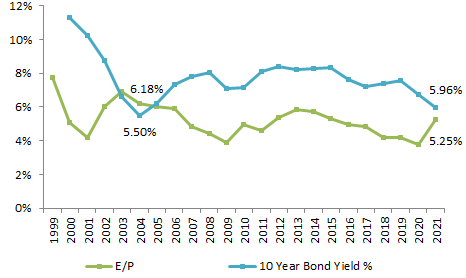
Compare Earnings yield with going bond yields now.
SENSEX vs 10 Year Government of India Bond Yield
Since interest is tax deductible, the after tax cost of debt or the after tax interest rate can be lowered by 25% (corporate tax rate), therefore the 10 year bond yield as of 22nd May 2020 of 5.96% is 4.47% after tax.
Essentially a corporate CEO running a business with earning yield of greater than 4.47% or a PE of ~22 can borrow money and buy back share of his own company and capture the spread between firms earning yield and after tax cost of debt.
I would like to add a caveat to it, that these 10 year bond yield are available to the most credit worthy borrower (government of India), any other institution apart from government of India will borrow money at 10 year bond yield of 5.96% + spread (credit worthiness).
However, we live in a globalised world where billions of dollars’ worth of transactions happens day in and day out. A big corporate having access to international lenders can definitely raise money at far lower rates than the prevailing rate (10 year bond rate) of 5.96%.
How should Individual Investors look at this?
FD rates (fixed deposit rates) are making new lows (6.5% for 10 year FD) and after tax these FD’s generate ~5% return. 100 Rupees invested into a fixed deposit will become 200 Rupees in ~15 years.
Prevailing earnings yield are 5.25% (as of 22nd May 2020) close to the 10 year FD rate of ~5%. But striking thing of equities is that the earnings grow while interest on FD stays the same throughout the investment time horizon.
Forward earnings yield is definitely higher than the trailing earning yield of 5.25% because profits of stocks grow while interest rate on FDs stays constant.
While some may debate that corporate India will report poor earnings for FY 21 (COVID 19 impact), I agree but I question them back on investment horizon, are they investing for 1 year when they compare equities and FDs.
If your investment horizon is long enough (5 to 10 years) then buying the S&P BSE SENSEX is a no brainer.
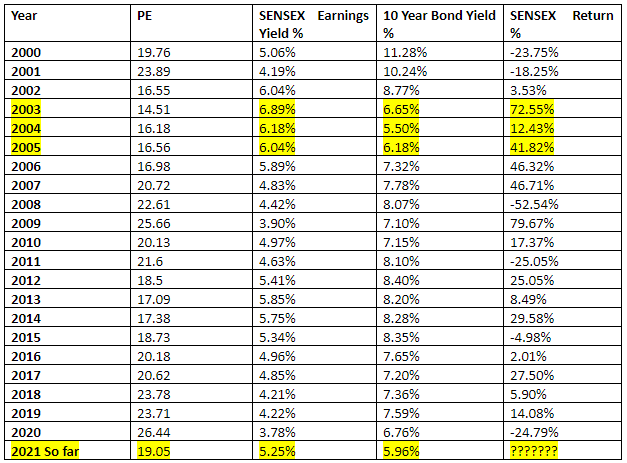
Never look at PEs of the index in isolation and compare it with historical highs or lows. Look at PEs and 10 year bond yields together.
In 2002, SENSEX had a PE of 16.55 (or E/P of 6.04%) while the 10 year bond yield was 8.77% in 2002.
Today SENSEX has a PE of 19.05 while 10 year bond yield have climbed down from 2002 levels of 8.77% to 5.96% today.
If someone compares todays PE (19.05) with PE of SENSEX in 2002 (16.55), then he would miss out on bargain buying opportunities presented today.
How do Earnings Yields differ from Bond Yields?
Let’s carry out a simple exercise and compare the SENSEX historical return to the spread between the 10 year bond yield and Earnings yield.
Rising spread implies that stock prices are falling and earning yield (trailing basis) look optically high or bond yields are climbing faster compared to earnings yield.
In either scenario, we are buying stocks for future profits and not trailing profits therefore having a ball park idea of the trajectory of corporate profitability is enough. Sitting today I have no doubt that corporate India will generate higher profits/earnings in another 2 to 3 years, therefore forward earnings yield look juicy for a bargain hunter.
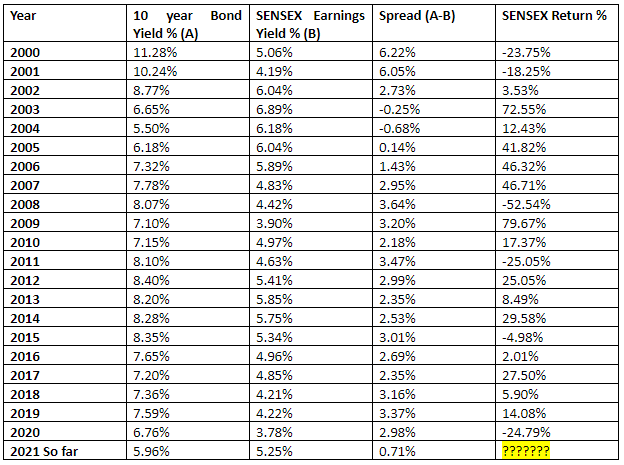
Correlation coefficient between the Spread (A-B), (10 year bond yield minus SENSEX earning yield) and SENSEX Return% is -0.54368
R square between the two variables is 29.55%.
A negative correlation coefficient implies a rising spread is bad for stocks and a narrowing spread is positive for stocks and -0.54368 is significant correlation when compared with the negligible correlation coefficient which financial pundits derive for trade deficit and stock market return (-0.06334) and budget deficit and stock market returns.
An R square of 29.55% implies 29.55% of the stock price movement can be understood from the spread variations (10 Year bond yield minus E/P trailing basis). This is again a significant causation relationship between two variables.
Buying BSE SENSEX is a no brainer for passive investor while an active investor can look into individual securities in the headline index.
Disclaimers :
The information herein is used as per the available sources of bseindia.com, company’s annual reports & other public database sources. Alpha Invesco is not responsible for any discrepancy in the above mentioned data. Investors should seek advice of their independent financial advisor prior to taking any investment decision based on this report or for any necessary explanation of its contents
Future estimates mentioned herein are personal opinions & views of the author. For queries / grievances – support@alphainvesco.com or call our support desk at 020-65108952.
SEBI registration No : INA000003106
Readers are responsible for all outcomes arising of buying / selling of particular scrip / scrips mentioned here in. This report indicates opinion of the author & is not a recommendation to buy or sell securities. Alpha Invesco & its representatives do not have any vested interest in above mentioned securities at the time of this publication, and none of its directors, associates have any positions / financial interest in the securities mentioned above.
Alpha Invesco, or it’s associates are not paid or compensated at any point of time, or in last 12 months by any way from the companies mentioned in the report.
Alpha Invesco & it’s representatives do not have more than 1% of the company’s total shareholding. Company ownership of the stock : No, Served as a director / employee of the mentioned companies in the report : No. Any material conflict of interest at the time of publishing the report : No.
The views expressed in this post accurately reflect the authors personal views about any and all of the subject securities or issuers; and no part of the compensations, if any was, is or will be, directly or indirectly, related to the specific recommendation or views expressed in the report.
Stay Updated With Our Market Insights.
Our Weekly Newsletter Keeps You Updated On Sectors & Stocks That Our Research Desk Is Currently Reading & Common Sense Approach That Works In Real Investment World.