China and India are the two most populous countries in the world. China was the most populous country with approximately 1.42 billion people in 2018. India was the second largest country by population with approximately 1.35 billion inhabitants in 2018. China and India together account for 36.28% of total world population 7,632,819,325.
We have compiled various macro economic growth indicators of the two countries to understand what led to rapid growth of China vs India.
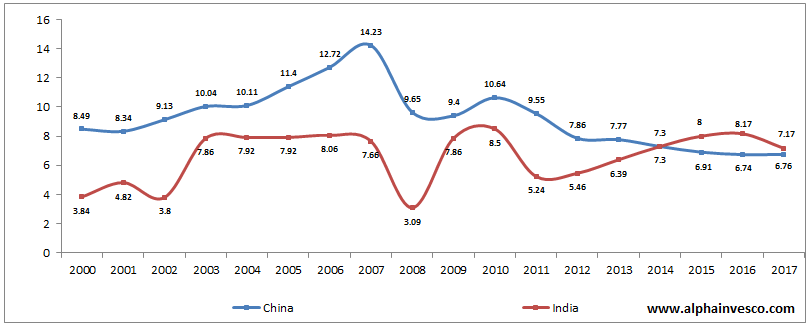
Economic growth: The rate of change of real GDP of India vs China (%)
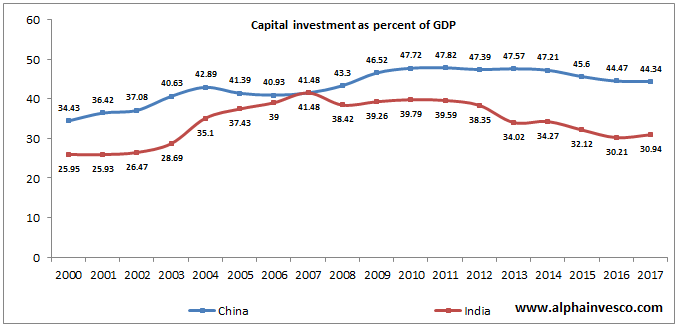
Capital investment as a percent of GDP
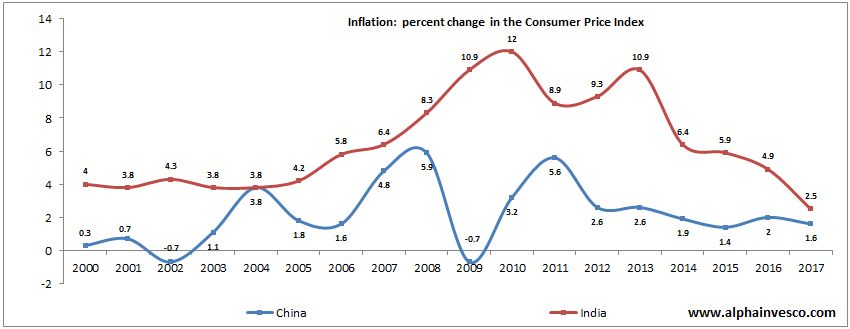
Inflation in India & China: percent change in the Consumer Price Index
India’s GDP growth rate in the last 17 years has averaged 6.61% CAGR while China’s GDP growth rate has averaged 9.28% CAGR. China’s capital investment as a percentage of GDP which is proxy for Investment as a percentage of GDP has averaged 43% while India’s investment as a percentage of GDP has averaged 34.2% in the last 17 years.
Subdued investment as a percentage of GDP has led lower India’s GDP growth rate while China has maintained investment rate. Indian economy growth rate will rise when capital investment rises for which we will need bigger government and private spending.
Population density of India vs China (people per sq KM)
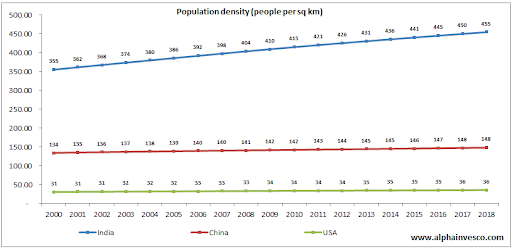
It is projected that by 2024, India will have more people than China with approximately 1.44 billion people. Currently, China’s population growth rate is 0.39%, while India is growing at 1.11%.
In 1950, the population of China was 554 million. While the population of India was 376 million. China crossed one billion mark in 1981 and India in 1998. By 2029, India will cross the 1.5 billion mark.
Population density of India is 455 people per square km compared to 148 of China. So, India is 2.96 times denser than China. China is 4th and India is the 7th largest country in terms of area.
GDP per Capita: India vs China, constant 2010 Dollars
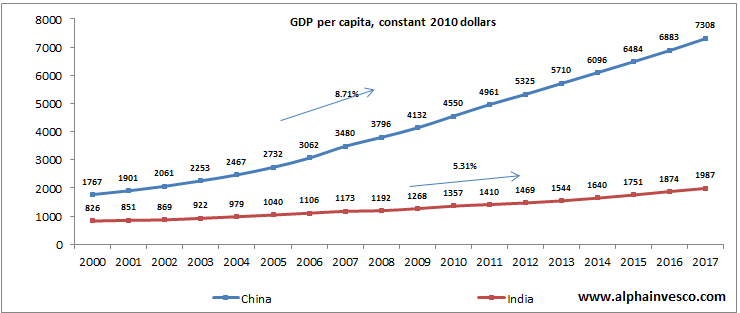
India’s GDP per capita has lagged to China’s GDP per capita. India grew its GDP per capita at 5.31% CAGR between 2000 and 2017 while China grew its GDP per capita at 8.71% CAGR.
Female Labour Force Participation Rate %
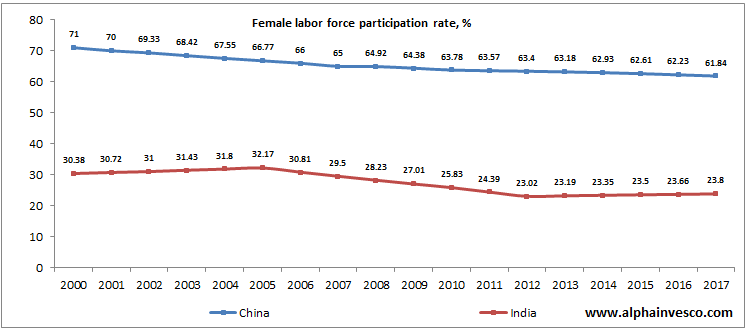
China’s GDP per capita in constant 2010 dollars grew from $1,767 in 2000 to $7,308 in 2017 translating a 8.71% CAGR while India grew its per capita GDP from $826 in 2000 to $1987 in 2017 at 5.31% CAGR. Slower per capita growth in India is partially because of lower female labour force participation rate ~23% while China has reported closer to ~60% female labor participation rate.
New passenger car sales in India vs China, numbers per year
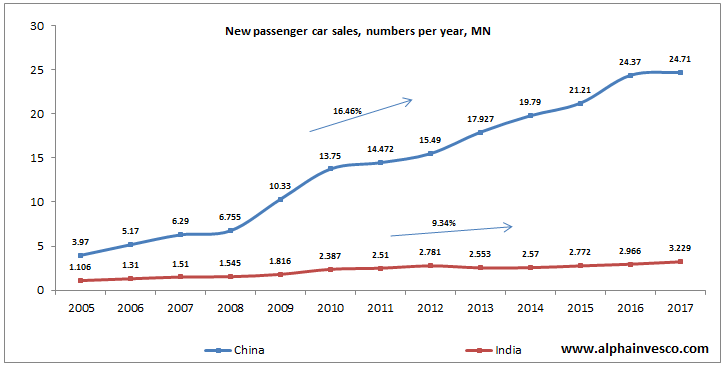
When you have such high population densities ~455 people per sq KM in India, your travelled distance declines, therefore an average family in India would need at most one 4 wheeler or none while in China an average family would travel more because of lower population densities ~148, further with rising GDP per capita incomes, your disposable income rises and you also have female workforce participation rising which enables an average Chinese family to purchase second 4 wheeler in the house.
China has cumulatively sold ~18.4 crore passenger cars between 2005 and 2017, while India sold ~2.9 crore passenger cars in the same period. China has ~45 crore households and India has ~25 crore households. Passenger cars have 40% penetration in China while ~11.6% in India.
India may never sell as many passenger cars as China did due to higher population densities and lower female labour force participation rates.
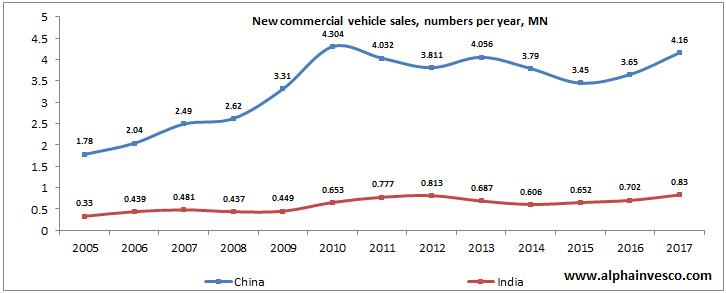
New commercial vehicle sales in India vs China, numbers per year
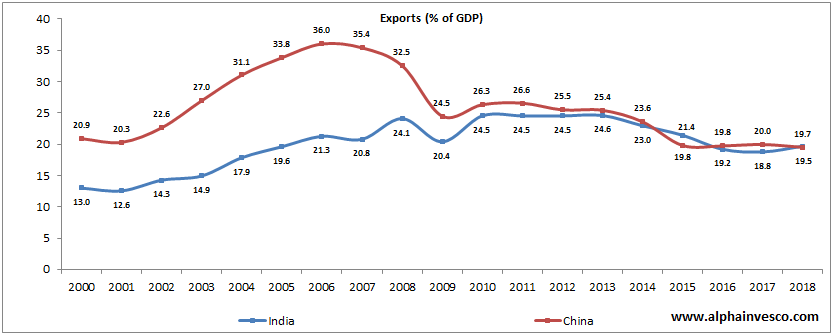
Exports as a Percentage of GDP of India vs China
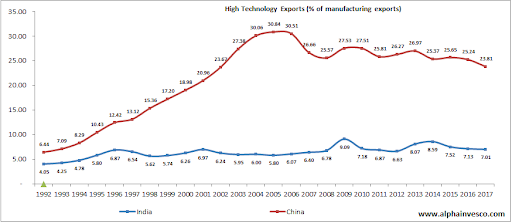
High Technology Exports (% of Manufacturing Exports)
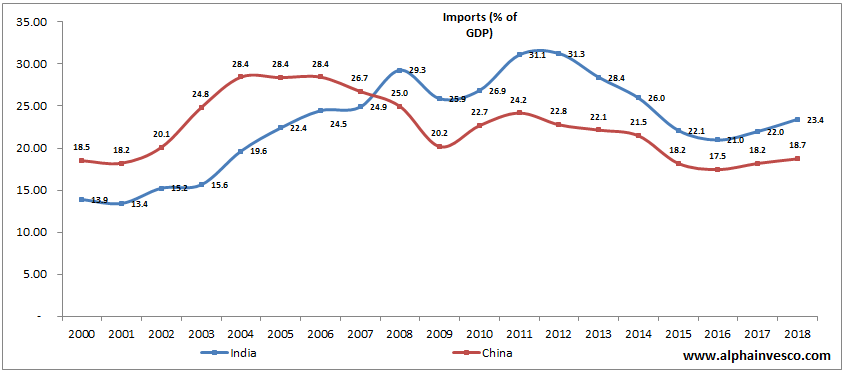
Imports as a Percentage of GDP of India vs China
China’s GDP growth was export led while India is still trying to generate trade surplus. China’s export as a percentage of GDP in 2006 peaked at 36% then it has gradually fallen and in 2018, China’s export as a percentage of GDP was 19.7%.
China has increased share of high technology exports as a percentage of total manufacturing exports averaging 21% while India delivered 6.4% in the last 25 years. High technology exports makes China competitive and it becomes a supplier which is difficult to replace vs other nations whose exports are commodity in nature.
Patents Filed in India vs China
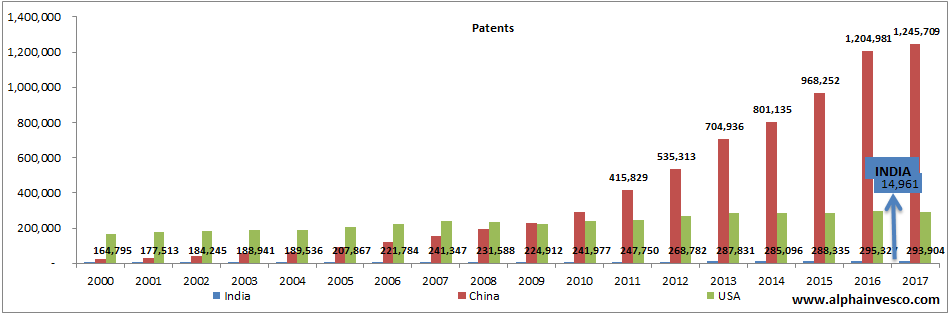
Any nation will want to build superior technology so that it garners the biggest share in the world economy, to build superior technology you need innovation which should translate into patents. In the last 17 years, China has increased patent filing, while India has not been able to come anywhere close to the number of patent applications by China. In 2017, India filed ~14,000 patents while China and USA filed 1.2 Million and 0.3 Million patents respectively.
Disclaimers :
The information herein is used as per the available sources of bseindia.com, company’s annual reports & other public database sources. Alpha Invesco is not responsible for any discrepancy in the above mentioned data. Investors should seek advice of their independent financial advisor prior to taking any investment decision based on this report or for any necessary explanation of its contents
Future estimates mentioned herein are personal opinions & views of the author. For queries / grievances – support@alphainvesco.com or call our support desk at 020-65108952.
SEBI registration No : INA000003106
Readers are responsible for all outcomes arising of buying / selling of particular scrip / scrips mentioned here in. This report indicates opinion of the author & is not a recommendation to buy or sell securities. Alpha Invesco & its representatives do not have any vested interest in above mentioned securities at the time of this publication, and none of its directors, associates have any positions / financial interest in the securities mentioned above.
Alpha Invesco, or it’s associates are not paid or compensated at any point of time, or in last 12 months by any way from the companies mentioned in the report.
Alpha Invesco & it’s representatives do not have more than 1% of the company’s total shareholding. Company ownership of the stock : No, Served as a director / employee of the mentioned companies in the report : No. Any material conflict of interest at the time of publishing the report : No.
The views expressed in this post accurately reflect the authors personal views about any and all of the subject securities or issuers; and no part of the compensations, if any was, is or will be, directly or indirectly, related to the specific recommendation or views expressed in the report.
Stay Updated With Our Market Insights.
Our Weekly Newsletter Keeps You Updated On Sectors & Stocks That Our Research Desk Is Currently Reading & Common Sense Approach That Works In Real Investment World.