High Level Advisory Group (HLAG) was constituted by Minister of Commerce and Industry, Dept. of commerce, Government of India, to assess the global environment and market recommendations for boosting India’s share and importance in global merchandise and services trade; managing pressing bilateral trade relations; and mainstreaming new age policy making.
The HLAG deliberated upon these issues in depth and drew upon its own research as well as on presentations by its members, the industry and several departments of the Government of India. Based on its deliberations, the HLAG arrived upon certain recommendations on issues included in its terms of reference. The draft of the Report was completed in May 2019 and submitted to the Department of Commerce, Government of India.
Status of Exports
Since the global financial crisis, India’s merchandise exports have increased from $185.3 bn to $303.5 bn, India’s share in global exports remains at 1.68% in 2017, as per WTO. India’s goods exports would be expected to remain at a share of 1.8% of world exports or would even fall. With global exports rising at conservative estimate of CAGR of 3.5% in the next 5 years, it would go up from $18 trillion in 2017 to $21.4 trillion in 2023.
While merchandise exports of goods and services constitute close to 63% of total exports, the share of service exports has been 37% during the last 3 years.
Is Exchange Rate Policy Responsible For Poor State of Exports?
It is often contended by experts that Indian exports have performed badly due to our exchange rate policy. This is a bad excuse. India’s real exchange rate index (BIS) between 2003-12 was 97.1; between 2012-17 it has averaged 97.8. Countries that have really performed well (Bangladesh & Vietnam) have seen large increase (over 30%) in real exchange rate. As has china (28% appreciation), as has Philippines (21%) and Thailand (10% appreciation).
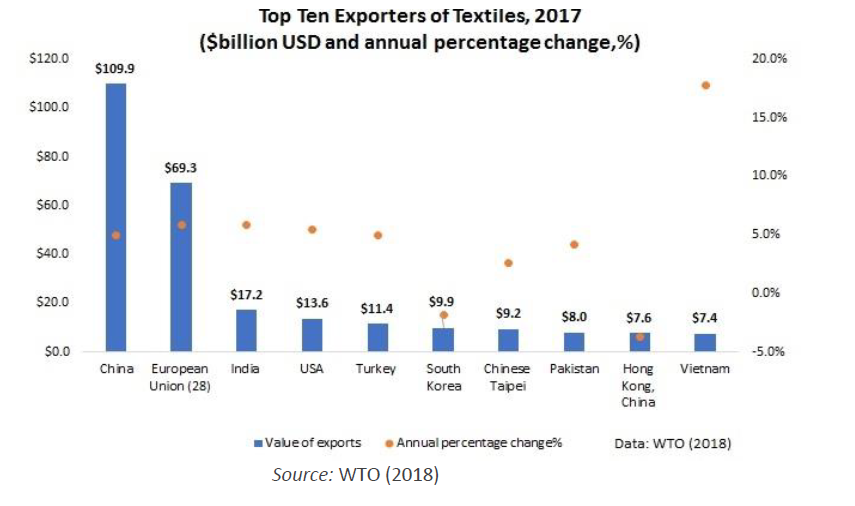
Textile Export
The value of the global textile export market totaled $667.5 bn in 2015 (83.1% fabric and 16.9% yarns), up 1.5% from a year earlier. The CAGR of the textile market was 4.4% between 2011-15. Textile export is India’s largest and oldest industries- India’s overall textile exports stood at $17 bn (for FY17-18). India is the largest producer of cotton & Jute worldwide and second largest producer of polyester, silk & fiber.
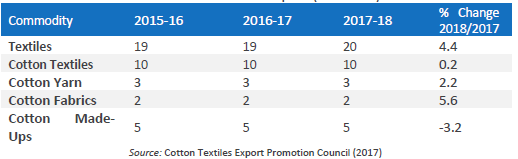
From employment stand point, textile export is the second largest generator of jobs in India. It is anticipated that the total number of jobs in textile will increase from 45 mn in FY2017-18 to 55 mn by 2020.
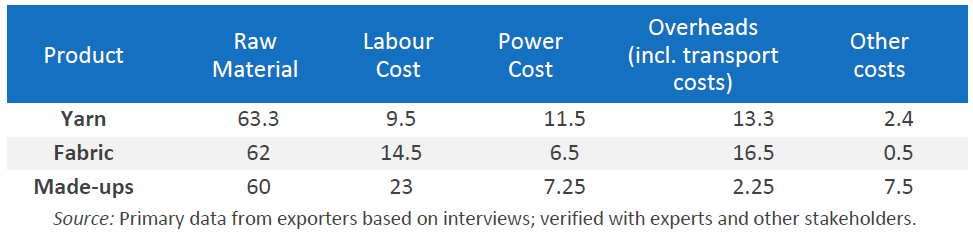
Cost Structure of Yarn, Fabric and Made Ups In The Textile Industry
Policy Recommendations for the Indian Textile Export to Rise
- Encourage emergence of larger companies which can invest in new technologies in the textile sector.
- Improve existing incentives to upgrade textiles technology and improve global competitiveness: Indian textile companies do not have high quality machinery that key competitors have due to significant machinery import duties and general high cost of purchasing.
- Enhance ease of lending and increase credit for tech up gradation.
- Tax reforms and concessions.
Apparel Exports – India
Global apparels Export trade reached $470 bn in 2017, and is expected to grow at CAGR of ~5% over the next 5 years. The key drivers of this growth in apparel export are increases in disposable income (doubled in China:2010-14) and urbanization in developing economies (1.8% – overall urban growth rate). Overall, the apparel exports space is significantly more labor intensive/less technology – dependent than textile (garments require unique designs for each product – it is often impractical to automate the process of producing thousands of unique garments).
The key competitive advantage that winners in apparel space will have is a large, low cost labor force- therefore; developing countries are more likely to do well.
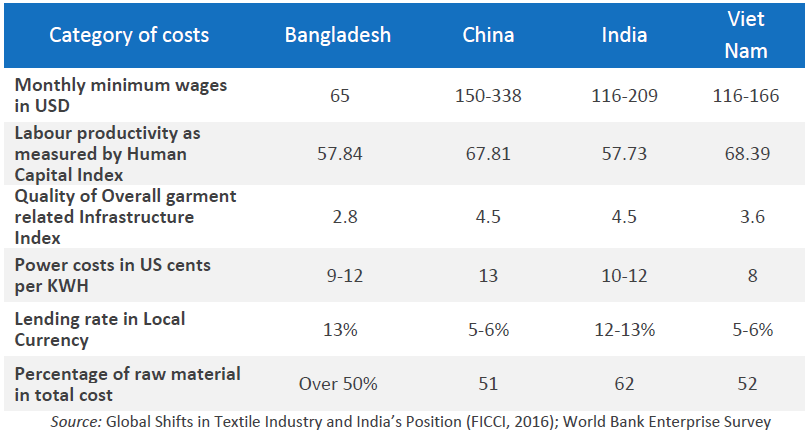
Since the value addition in apparel exports is low compared to textile and because of its rising wages, china is consciously shifting its apparel industries to lower cost destinations like Viet Nam and Bangladesh.
Tourism & Hospitality
As per industry estimates, tourism and hospitality sector accounted for 10.4% of global GDP and 9.9% of total employment (313 mn jobs), in 2017.
As a worldwide export category, tourism ranks third after chemicals and fuels and ahead of automotive products. In many developing countries, tourism is the top export category. Total exports from international tourism reach $1.6 trillion, or $4 bn a day on average.
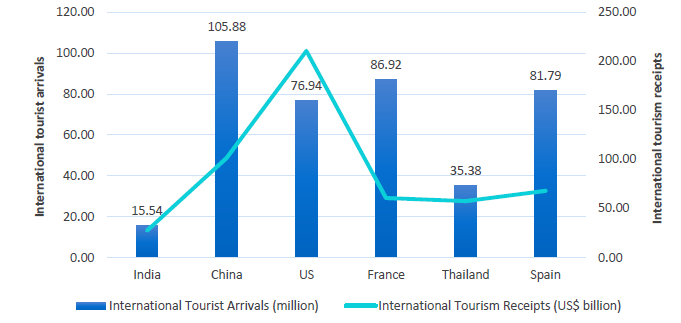
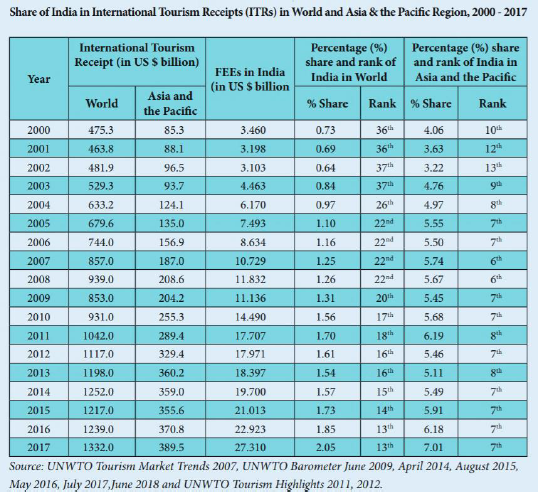
Total contribution of Tourism and hospitality to India’s GDP in 2017 is estimated to be $234 bn, 9.4% of GDP.
Challenges
- The rising land prices in India and high financing cost have resulted in high room tariffs and long gestation periods for achieving break even.
- Rooms that cost $400 a night in delhi would cost close to $100 in china. While organizations as OYO and airbnb have stepped in to help fill a void, more needs to be done to bridge the gap.
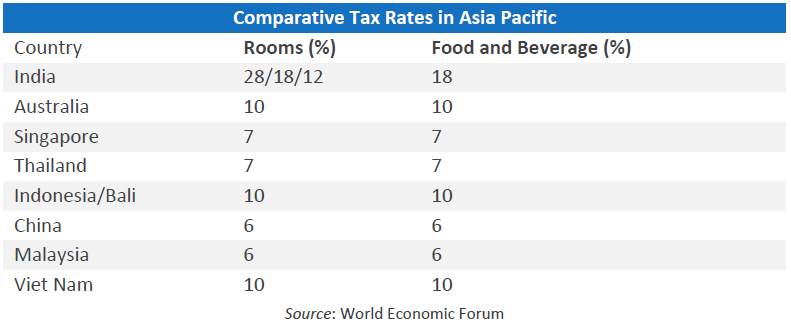
- As a result of GST, India now has some of the highest tax rates in Asia Pacific region.
Policy Recommendations
- Create a pan India Tourism board.
- Development of tourism research wings at the center and state level.
- Identify gaps in tourism infrastructure.
- Accord infrastructure status to tourism infrastructure and mend tax rates.
- Make access to Indian tourist visa even faster and cheaper.
- Building business operations and hospitality skills in rural areas.
Highlighted Report Of High Level Advisory Group
Subscribe to our WhatsApp and receive updates directly:

Disclaimers :
The information herein is used as per the available sources of bseindia.com, company’s annual reports & other public database sources. Alpha Invesco is not responsible for any discrepancy in the above mentioned data. Investors should seek advice of their independent financial advisor prior to taking any investment decision based on this report or for any necessary explanation of its contents
Future estimates mentioned herein are personal opinions & views of the author. For queries / grievances – support@alphainvesco.com or call our support desk at 020-48931507.
SEBI registration No : INA000003106
Readers are responsible for all outcomes arising of buying / selling of particular scrip / scrips mentioned here in. This report indicates opinion of the author & is not a recommendation to buy or sell securities. Alpha Invesco & its representatives do not have any vested interest in above mentioned securities at the time of this publication, and none of its directors, associates have any positions / financial interest in the securities mentioned above.
Alpha Invesco, or it’s associates are not paid or compensated at any point of time, or in last 12 months by any way from the companies mentioned in the report.
Alpha Invesco & it’s representatives do not have more than 1% of the company’s total shareholding. Company ownership of the stock : No, Served as a director / employee of the mentioned companies in the report : No. Any material conflict of interest at the time of publishing the report : No.
The views expressed in this post accurately reflect the authors personal views about any and all of the subject securities or issuers; and no part of the compensations, if any was, is or will be, directly or indirectly, related to the specific recommendation or views expressed in the report.
Stay Updated With Our Market Insights.
Our Weekly Newsletter Keeps You Updated On Sectors & Stocks That Our Research Desk Is Currently Reading & Common Sense Approach That Works In Real Investment World.