Disclaimer: This post on the Indian Banking Sector is not a recommendation to buy / hold / sell any securities or any bank mentioned in the blog post. The published post is for information purpose only. The intention to share write ups on this blog is to create a repository of ideas so that investors can have a look at various frameworks & approaches. Please read the detailed disclaimer at the bottom of the post.
Indian Banking – Current Landscape, Some Facts & Figures
Before starting with article, if anyone is interested in studying banking sector, I’d like to encourage you to visit the RBI website (https://rbi.org.in/Scripts/Statistics.aspx & https://dbie.rbi.org.in/DBIE/dbie.rbi?site=home). The RBI website has almost all the information/statistics one would want, and is fairly easy to search. Some of the data in this article has been sourced from there.
Throughout the blog, we are taking top 5-6 banks in private and PSU banks segment. Top 5 PSU banks account for ~60-65% of total PSU bank advances, and top 5 private banks account for ~80% of the total private bank advances. This makes them fairly representative of their respective segment for our analysis. This data-backed blog is going to be a long read, but it aims to help the reader understand the history of entire Indian banking industry, its current situation and the recent updates at a one stop location. So let’s begin!
Indian Banking Sector Over Last 25 Years :
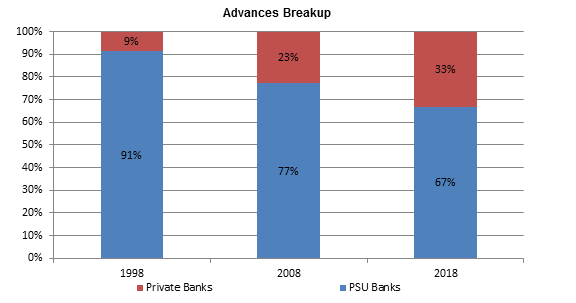
Since 1994, the private banks have grown their advances at ~38% CAGR v/s. public banks growing it at ~19%. That is twice as fast for two and half decade! We can see that in the below chart, how the contribution of advances by the banking sector has been increased by the private banks.

Market Share in Advances :
Private banks’ share in credit by banking sector has increased from mere ~1.5% in 1994 to now 1/3rd of total banking credit over last two and half decade.
Despite PSU banks having twice the advances of that of their private peers, they enjoy just 1/3rd valuations of that of private banks!
| Bank Type | Advances (Cr) | Market Cap (Cr) |
| PSU Banks | ~57,50,000 | ~4,50,000 |
| Pvt Banks | ~28,00,000 | ~15,00,000 |
Let us try and understand why such an anomaly exists:
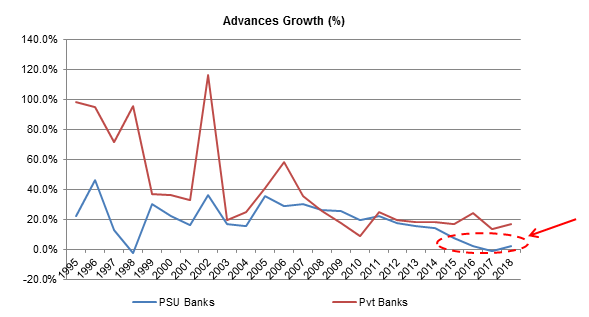
Credit Growth :
We can see, consistently throughout the years since 1995, private banks have managed to grow their credit at much higher rate than their PSU peers. When we consider credit growth, we should separate post 2014 years from the past. The credit growth for PSU banks suddenly dropped from 22% CAGR (1994-2014) to 2% CAGR (2014-2018). Whereas, the private banks continued to grow at 18-20% rate. We can see that in the graph below:
When we break down the advances, we can see that PSU banks had heavily lent to corporates, compared to their private peers focusing on retail lending. You would have understood from our previous blog, that lending to corporates has higher NPA probability compared to retail lending, mainly due to absence of measures like Insolvency & Bankruptcy Law in the past. We can see in the below graph, the higher the ratio of corporate loans to consumer loans (X-axis), higher is the bank’s NPA:
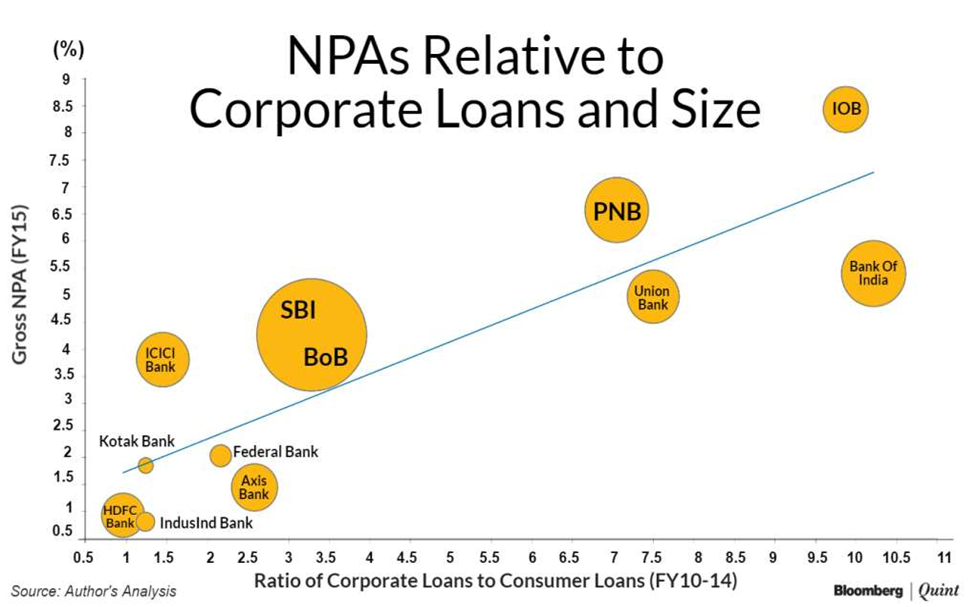
Source: Bloomberg Quint
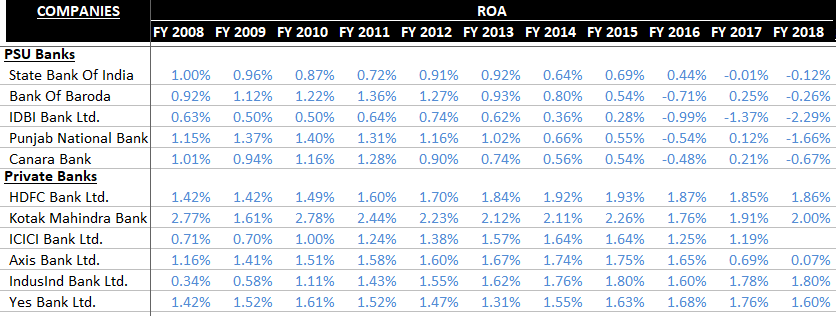
Private Banks Enjoy Higher Return on Assets ( ROA ) :
As we know, retail lending is also the one with better yields, we can see how some top PSU and private banks have fared in terms of their ROAs over the last decade. We can also notice how the ROAs have turned negative for PSU banks in last couple of years due to higher provisions because of their higher NPAs.
Reasons for High Return On Assets for private banks :
There are multiple reasons for private banks delivering better ROAs than their public peers.
- Credit Cards & Cross Selling : Cross selling includes selling of Bancassurance (Health and Life Insurance), Asset Management, etc. Credit card and cross selling businesses are of high yielding nature. These businesses have more stable fee and commission income, compared to the Interest Income a bank earns which is more of a commodity type business and is susceptible to interest rate volatilities. The private banks realized this benefit and have focused on growing these businesses. Just as an example, private banks’ share in mobilising funds for mutual funds was nil until 1993. However, within a matter of 6 years, their share rose to 80% by 1999, and has remained 80%+ since then. Also, we can see the number of credit cards issued by some top banks and their growth over last 7 years:
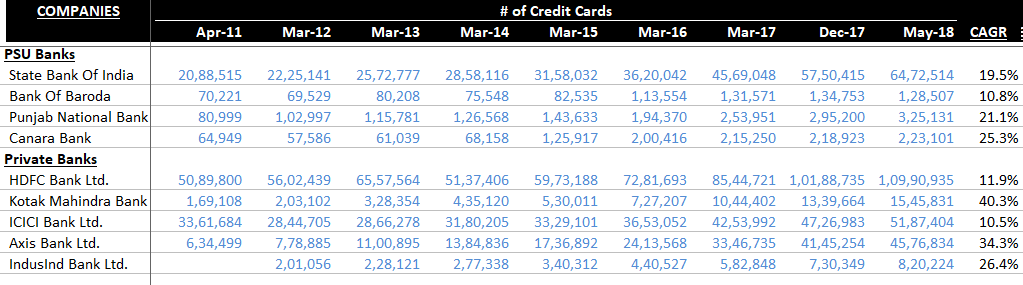
(Note: The CAGR for HDFC bank is lower, but that is at a comparatively high base!)
Out of 2.5 crore credit cards issued in India, HDFC Bank alone has issued almost 1.1 cr credit cards ! That’s a whopping 40% market share in the credit cards. Also, HDFC Bank has issued 4 credit cards for every 10 debit cards. That’s some serious cross selling, as most of these cards are issued to banks own customers. Exact data is not available on the same.
On the other hand, SBI has issued almost 28 cr debit cards but only 65 lakh credit cards. For BOB the ratio is even worse. Traditionally PSU banks have fared poorly when it comes to selling credit cards, bancassurance, auto loans etc. And that’s where private banks have scored. Resulting in higher yield assets & perhaps higher ROA / ROE profile. If PSU banks start cross selling various products to their existing customers, they will enter a different league altogether, mainly due to their huge network & customer base. But there is a big ‘IF’.
| Bank | No Of Debit Cards Issued (May-18) | No Of Credit Cards Issued (May-18) |
| State Bank of India | 28.3 cr | 65 lacs |
| Bank of Baroda | 5.3 cr | 1.3 lacs |
| Punjab National Bank | 6.4 cr | 3.3 lacs |
| Canara Bank | 4.5 cr | 2.2 lacs |
| HDFC Bank | 2.5 cr | 1.1 cr |
| Kotak Mahindra Bank | 0.9 cr | 15.5 lacs |
| ICICI Bank | 4.3 cr | 52 lacs |
| Axis Bank | 2.3 cr | 46 lacs |
| IndusInd Bank | 0.4 cr | 8.2 lacs |
| Yes Bank | 0.2 cr | 3 lacs |
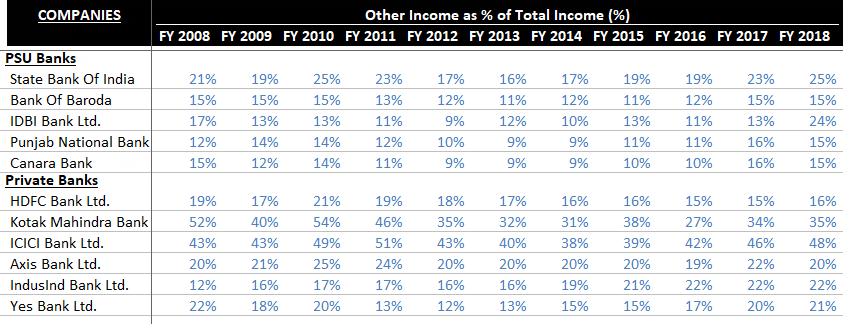
- Non-Interest Income : Another way of looking at non-cyclical fee and commission income is the ‘Non-Interest’ part of the income of a bank. The higher it is, more stable and better quality income it gets. Non-Interest Income is also known as ‘Other Income’.
- Retail Lending : Until 2014, private banks lent Rs 150 to corporates for every Rs 100 lent to the consumer. Whereas, the PSU banks lent Rs 700 to corporates for every Rs 100 to consumers. This higher exposure towards retail helps in improving a bank’s profitability.
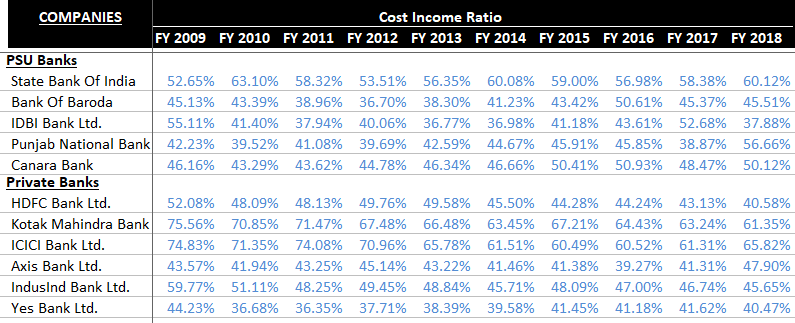
- Cost to Income : Lower Cost Income ratio also aids in improving the ROAs of a bank. However, if a bank is growing and incurring expenses for the same, the bank might have higher Cost Income ratio. Generally, Cost Income ratio in the neighbourhood of 45 – 50% is considered to be good. PSU’s in general have higher operational expenditures & lower retail business per branch, which results in higher cost to income ratio. Private banks have done a good job in getting higher retail business per employee / per branch, which keeps their cost to income ratio’s lower.
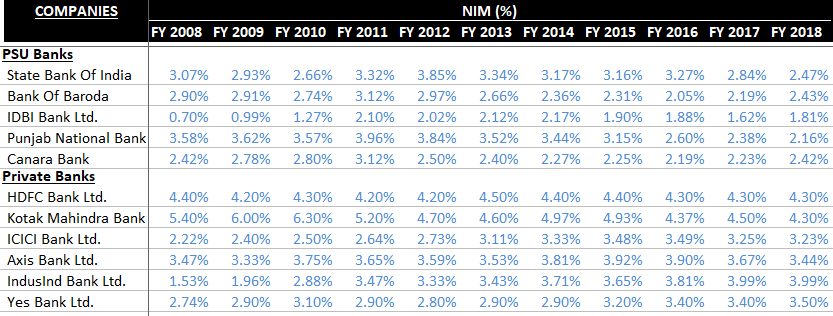
- Better Net Interest Margins :
Higher CASA certainly helps is lowering the cost of funds for any bank. A combination of higher CASA & higher yield retail lending has resulted into better NIM’s for private banks. PSU banks have a solid liability franchise that is built over decades. Their CASA / cost of funds is lowest amongst all banks. However, higher share of corporate lending brings the NIM’s down.
Branch Network & Productivity Over The Last Decade :
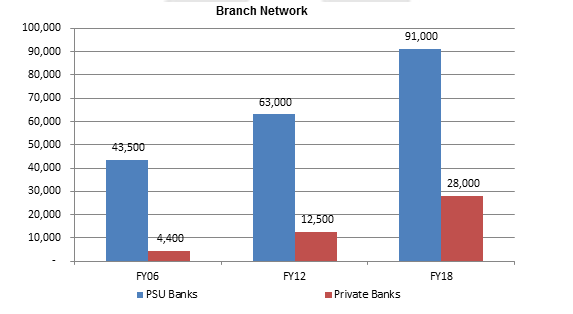
This is something that all of us would have observed in our surroundings. The names of banks in our vicinities during the 2000s and today are quite different. The total branches of all PSU banks has only doubled since 2006 to ~90,000, whereas number of private bank branches have grown from 4400 to 28000 over the same time frame. A 6x increase ! However, even today, PSU banks have 3x more branches than private banks. How well they can leverage this footprint is to be seen. The banks with better branch network are more likely to show better CASA numbers.
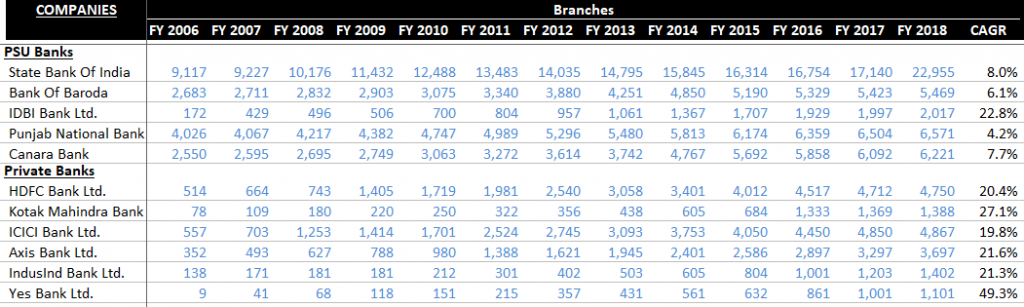
Data of branch network of some top banks :
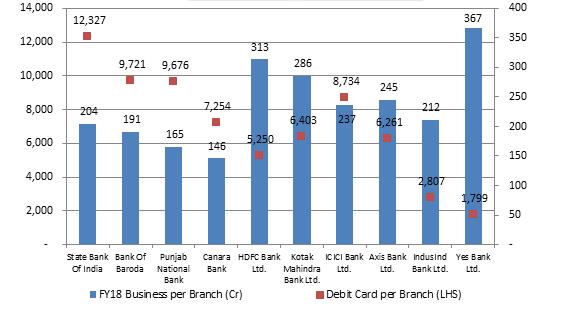
However, due to digitization, the rate of adding new branches has started to decrease for the banking industry as a whole. Higher digitization and aggressive growth culture has resulted in the business done per branch (Advances + Deposits) by private banks is way more than their PSU peers. Business per branch is higher for private sector despite being retail banks, where ticket size is lower compared to corporates. If PSU banks start growing their retail book i.e. Auto / housing / car loans with aggression, then their business per branch can be at par with private banks.
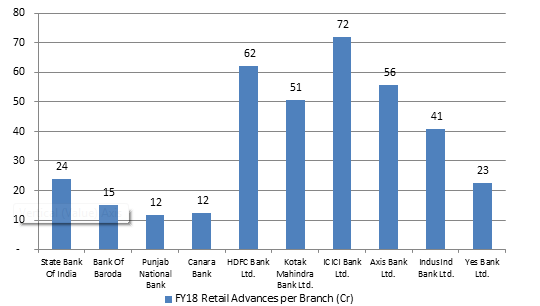
Looking at Retail Advances per Branch gives a better view on how private banks have penetrated the retail credit market. The per branch number of retail advances is way higher for private banks than business per branch.
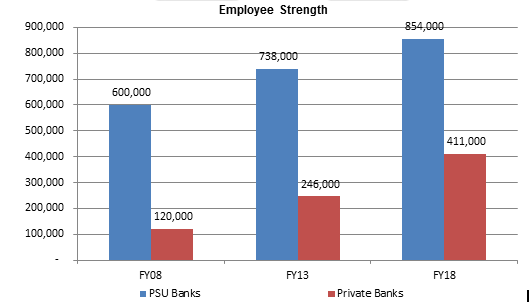
Employee Strength :
We can see the similar trend in number of employees. PSU banks have added just ~250,000 more employees in last decade with total employee strength of ~850,000 today, whereas private banks have more than tripled their employee strength to ~410,000 employees in the same period.
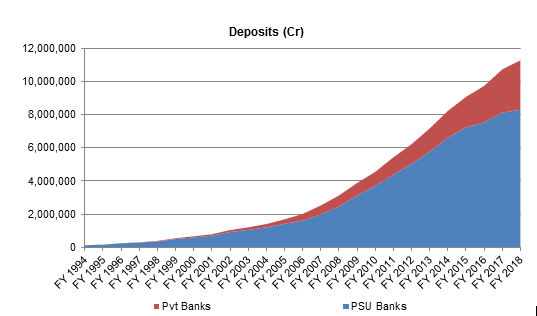
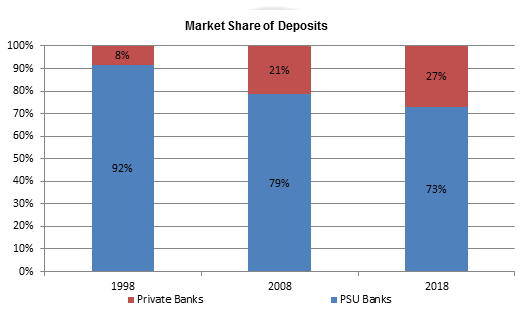
Deposits :
This aggressive expansion of branch networks by the private banks has benefitted them by increasing their share in the pie of deposits.
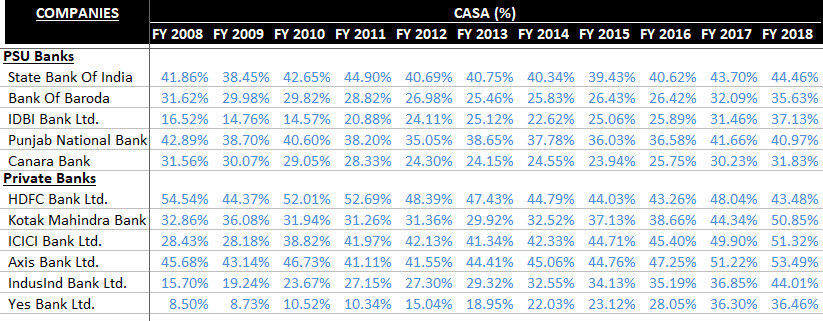
CASA (%) :
In the table below, we can see, that amongst the top banks, the lowest private banks CASA of HDFC Bank is comparable to the best PSU bank CASA of SBI. Better CASA leads to cheaper source of funds for the banks helping in improving their NIMs and ROAs.
In the next blog, we will take a look at the current NPA mess, how insolvency & bankruptcy law is changing the game, and whether the peak provisioning cycle is almost done with.
Disclaimers :
The information herein is used as per the available sources of bseindia.com, company’s annual reports & other public database sources. Alpha Invesco is not responsible for any discrepancy in the above mentioned data. Investors should seek advice of their independent financial advisor prior to taking any investment decision based on this report or for any necessary explanation of its contents
Future estimates mentioned herein are personal opinions & views of the author. For queries / grievances – support@alphainvesco.com or call our support desk at 020-65108952.
SEBI registration No : INA000003106
Readers are responsible for all outcomes arising of buying / selling of particular scrip / scrips mentioned here in. This report indicates opinion of the author & is not a recommendation to buy or sell securities. Alpha Invesco & its representatives do not have any vested interest in above mentioned securities at the time of this publication, and none of its directors, associates have any positions / financial interest in the securities mentioned above.
Alpha Invesco, or it’s associates are not paid or compensated at any point of time, or in last 12 months by any way from the companies mentioned in the report.
Alpha Invesco & it’s representatives do not have more than 1% of the company’s total shareholding. Company ownership of the stock : No, Served as a director / employee of the mentioned companies in the report : No. Any material conflict of interest at the time of publishing the report : No.
The views expressed in this post accurately reflect the authors personal views about any and all of the subject securities or issuers; and no part of the compensations, if any was, is or will be, directly or indirectly, related to the specific recommendation or views expressed in the report.
Stay Updated With Our Market Insights.
Our Weekly Newsletter Keeps You Updated On Sectors & Stocks That Our Research Desk Is Currently Reading & Common Sense Approach That Works In Real Investment World.