Disclaimer: The Blog on ‘Shipping Industry’ is not a recommendation to buy / hold / sell any stock. Please read the detailed disclaimer at the bottom of the post.
How Does the Shipping Industry Work?
The international shipping industry is responsible for the carriage of around 90% of world trade. Without shipping, intercontinental trade, the bulk transport of raw materials, and the import/export of affordable food and manufactured goods would simply not be possible.
Seaborne trade continues to expand, bringing benefits for consumers across the world through competitive freight costs.
In this blog we will try to understand the shipping industry.
Tankers
Crude Tankers– VLCC, Suexmax and Aframax
VLCC –
These are Very large crude carriers (VLCC) which have a capacity ranging between 180,000 to 320,000 DWT. They are extensively used in North Sea, Mediterranean and West Africa.
Suezmax –
They are named after the Suez Canal. They are mid-sized cargo vessel with a capacity between 120,000 to 200,000 DWT.
Aframax –
These vessels are ideal for short to medium haul oil trades and have a capacity between 80,000 to 120,000 DWT. They are used in regions which lack large ports to accommodate giant oil carriers.
Product Tankers–
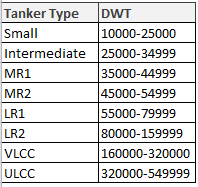
These are used for bulk transporting of petroleum products such as gasoline, kerosene, naptha and gas oil. LR1, LR2, MR1, MR2 fall under the product tanker category.
Bulk Carriers–
These vessels are designed to carry dry, unpackaged cargoes in large quantities like coal, ore, cement, grains, cargoes whose containerized transportation would be highly uneconomical. Capsize, panamax, handymax, handysize fall under the bulk carrier category of tankers.
Tanker Trade Terminology –
DWT –
Deadweight tons, which refers to the carrying capacity of a vessel by weight.
Freight Revenue –
Money paid by a charterer to the ship owner for the use of a vessel under a voyage charter.
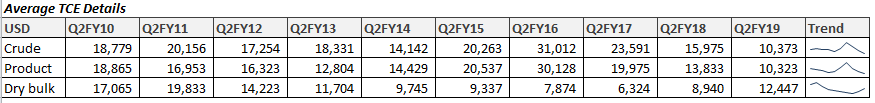
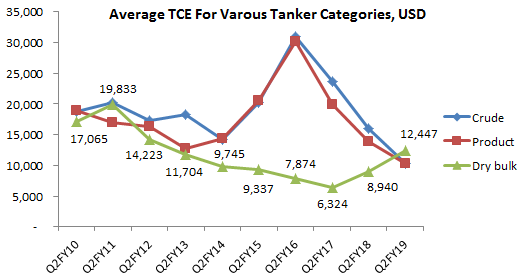
TCE –
Time charter equivalent, a standard industry measure of the average daily revenue performance of a vessel. The TCE rate achieved on a given voyage is expressed in $/day and is generally calculated by subtracting voyage expenses, including bunker and port charges, from voyage revenue and dividing the net amount (time charter equivalent revenues) by the round-trip voyage duration.
Voyage Expense –
Expenses incurred due to a vessel traveling to a destination, such as fuel cost and port charges.
Vessel Operating Expense –
The costs of operating a vessel that are incurred during a charter, primarily consisting of crew wages and associated costs, insurance premiums, lubricants and spare parts, and repair and maintenance costs. Vessel operating expenses exclude fuel and port charges, which are known as “voyage expenses.”
Dry Docking –
The removal of a vessel from the water for inspection or repair of those parts of a vessel which are below the water line. During dry dockings, which are required to be carried out periodically, certain mandatory classification society inspections are carried out and relevant certifications issued. Dry dockings are generally required once every 30 to 60 months.
Special Survey –
An extensive inspection of a vessel by classification society surveyors that must be completed at least once during each five year period. Special surveys require a vessel to be drydocked.
Time Charter –
A charter under which a customer pays a fixed daily or monthly rate for a fixed period of time for use of the vessel. Subject to any restrictions in the charter, the customer decides the type and quantity of cargo to be carried and the ports of loading and unloading. The customer pays the voyage expenses such as fuel, canal tolls, and port charges. The ship owner pays all vessel operating expenses such as the management expenses, crew costs and vessel insurance.
How Does a Ship Owner Make Money?
Ship owner either charts out their ships in the spot markets or signs a time charter with a charterer (refinery, iron ore importer, grain importer etc), under time charter a customer pays a fixed daily or monthly rate for a fixed period of time for use of the vessel.
Ship owner pays the entire vessel operating expense such as wages, repairs, insurance premiums, lubricants, dry docking charges and special survey charges. These expenses are fixed in nature, unlike road logistics where the fleet operator (truck owner) has to pay for the fuel expense which is the biggest expense in the income statement of a truck logistic company; here the ship owner does not pay the fuel expense and the port charges which can be related to the toll charges in case of road logistics.
Fuel and port charges fall on the head of the charterer (refinery) and these are called voyage expenses.
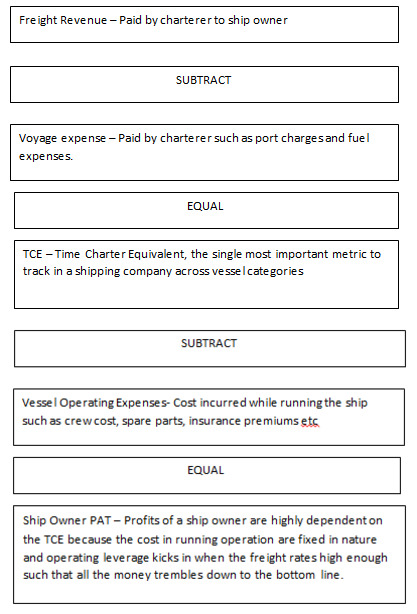
A ship owner optimizes to maximize the TCE (time charter equivalent) measured in USD which is calculated after we subtract the voyage expenses (fuel and port charges) from the freight revenue.
The images down below shows the water fall structure to profits for a ship owner.
During good times for the industry when the freight rates are trending north, we see huge operating leverage kicking in for the entire industry where the EBITDA margins are as high as 55%, though even in a flattish period, when freight rates are not so high, EBITDA margins are in 40 % range, thus proving that the shipping business in general is a high margin business.
Crude Tanker Fleet Growth and Order Book
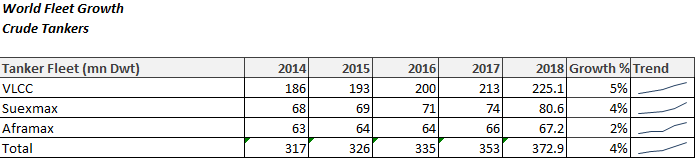
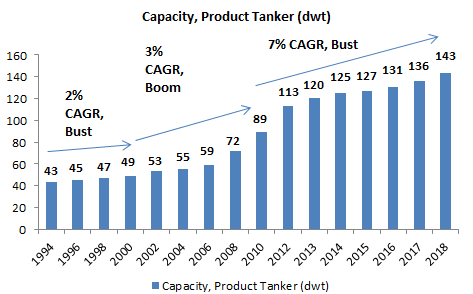
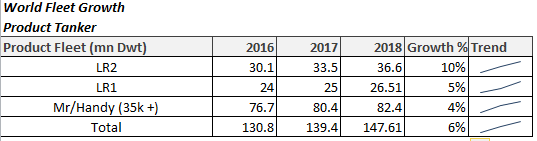
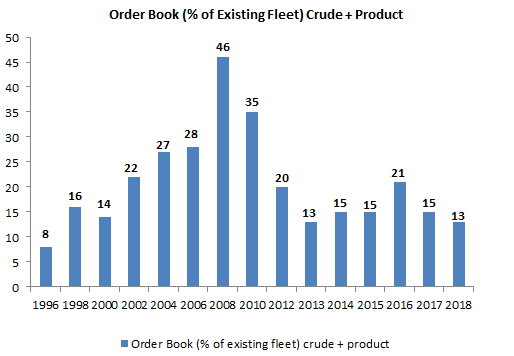
Though the fleet growth in the crude tanker segment has averaged 4% over the last 4 years (DWT grew from 317 mn dwt to 372 mn dwt) and for product tankers the growth has been 6% over the last two years but the underlying order book for both the categories of ships has shrunk, the order book in 2018 stands at 13% in 2018 and going in 2019 we will see 7% more deliveries and then contraction again in 2020. This shrinkage in order book is an impetus for the industry as the freight rates should rise in supply constrained environment.
Fleet Growth and Order Book Under The Dry Bulk Fleet
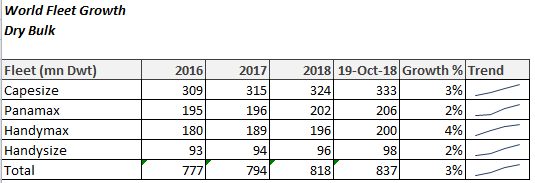
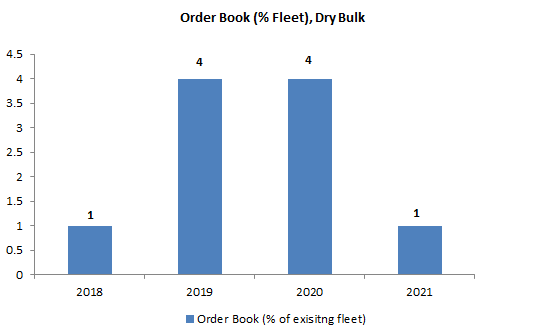
Fleet growth has averaged 3% under the dry bulk tanker category lowest amongst all tankers, thus the recovery of freight rates also started off from Dry bulk tankers. Coal and iron ore imports to china and the world are two important commodities to keep an eye on when tracking the dry bulk tanker freight rates. Higher demand for these two commodities leads to higher utilization of the vessels and also higher freight rates.
Tailwinds For The Shipping Industry
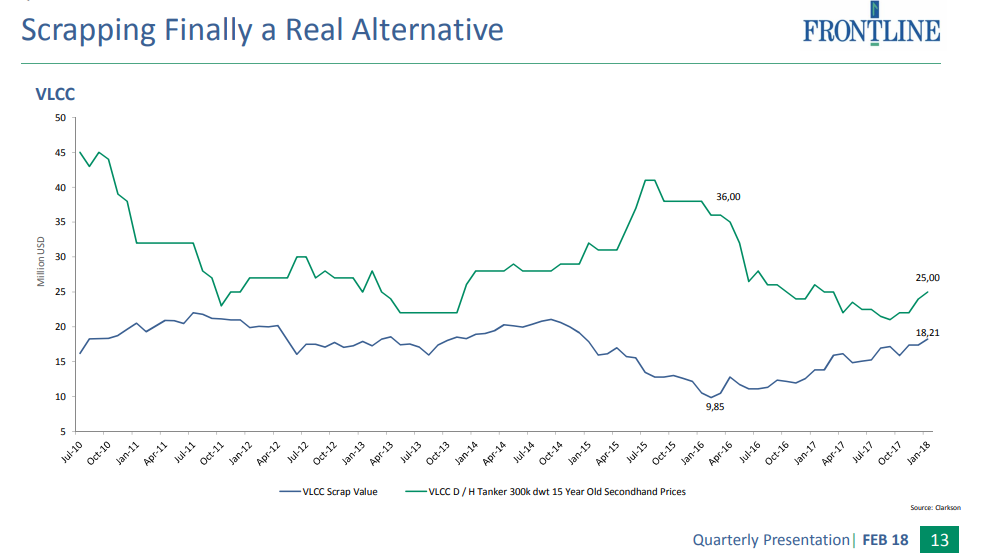
Scrapping- The decision to either scrap the ship or sell it in a transaction depends upon the price differential between second hand ship and prevailing scrap price. We are currently in an environment where steel prices have rebounded and along with it scrap prices have also rebounded.
A seller of a ship in the market has two alternatives –
- Second hand sale
- Scrap sale
Second hand sale will not bring staggering money because the services these ships provide (transportation) is not able to command higher prices (higher freight rates), therefore the ship seller can send the ship in the scrap yard.
These ships are dismantled and then their scrap is burnt in an EAF or IF of a steel plant. Chinese EAF/IF industry has policy support; Chinese production of steel from EAF will go up from 6%in 2017 to 20% in 2020
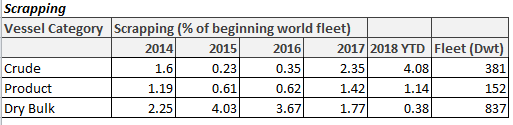
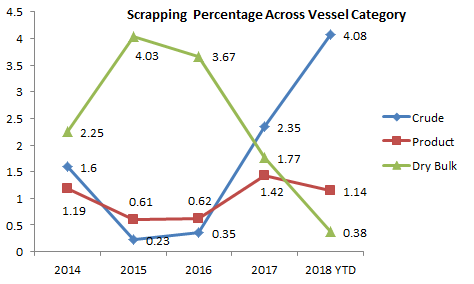
Scrapping is higher for crude tankers and lowest for dry bulk tankers which signal that along with a lower order book for crude tankers, we have the support from scrapping activity in this vessel category.
Why is Crude Tanker Fleet Seeing Higher Scrapping?
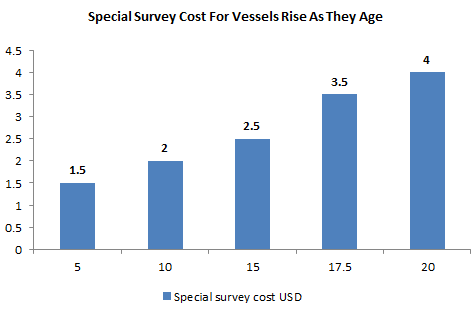
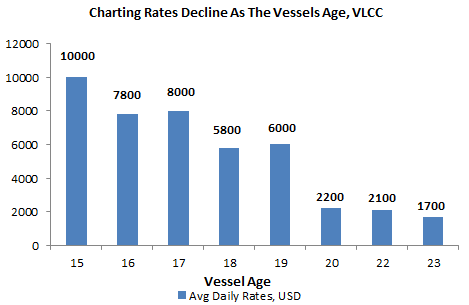
Crude tankers such VLCC’s, Aframax, Suexmax are seeing higher scrapping because of lower freight rates as explained above and also because of the age. Older vessels tend to underperform newer vessels in operations and newer vessels command higher freight rates resulting into higher TCE and older vessels also require frequent repairs and maintenance work (higher vessel operating expenses).
With age, the dry docking cost and special survey cost also rises which further supports scrapping of the vessels in a low freight environment constraining the supply.
Key Catalysts
- Sustained high tanker scrapping: Sustained high scrapping for tankers over FY18-22E is essential for supply to flatten and thus drive improvement in charter rates for tankers. We should closely monitor this catalyst over the next couple of years.
- Rising compliance cost: Impact of ballast water treatment and IMO-2020 regulations will materialize over the next two years. These regulatory changes will actually increase hurdle rates required to run a tanker business profitably, thus increasing scrapping of older vessels.
Dynamics of IMO-2020 Regulation
According to IMO-2020 regulation, ships have to burn low sulphur fuel starting 2020; ship owners have two options either procure low sulphur fuel from refineries or install scrubbers on the ships which will convert high sulphur fuel burnt today into low sulphur fuel.
Refineries currently do not have enough capacity of the low sulphur fuel, hence there will be supply constraint of this new fuel starting 2020 which will raise prices and thus voyage expenses for the charterers, which would mean freight rates should trend northward and thus we should hope an improvement in TCE for the ship.
Further, if everybody moves to low sulphur fuel, ships will run at slower speeds because the speed optimization depends on price of fuel. At higher fuel prices, your optimal speed is lower, which means the trip which used to happen in 60 days will take 65 days thus reducing the ship days and hence it will act like a synthetic supply constraint for the Industry further boosting the freight rates.
However, few ship owners will install scrubbers then it will be an expensive affair (high CAPEX) without clarity on the granularity of the regulation sitting in 2018. Further not many ship owners will be able to raise capital for this kind of CAPEX.
Debt Cycle of a Ship Owner
Generally in a cyclical industry, it is important to monitor the survival of the assets or the ships in shipping. It does not matter whether exiting owners of the ships survive the down turn because if the asset is value accretive it will always find a buyer who would run it and compete in the market.
The catch here is that the market should remain low for a long period, then the ship will get scrapped because nobody will find it lucrative enough to run the ship and this would bring real change (reduction in number of ships) in the supply of ships in the market. This is what that needs to happen.
This is currently happening in the crude tanker market where the freight rates are so low that people are saying it does not make sense to run these ships, let us sell them for scrap.
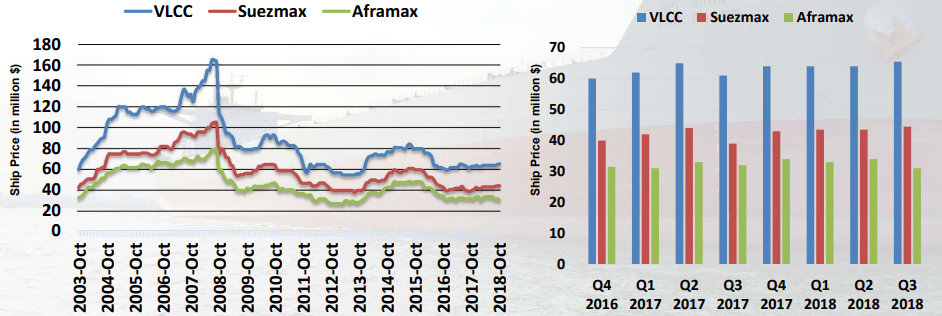
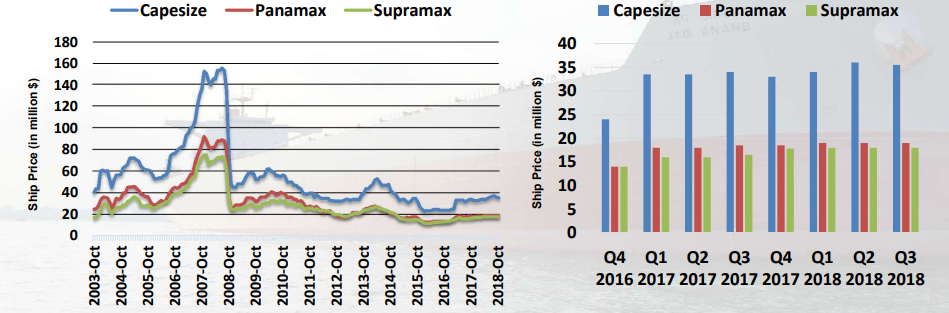
Asset Prices
Ship owners can also book onetime gains on the ships if they sell them in a good market. The ships get revalued every quarter and it is on the ship owner’s discretion when he wants to sell them, though it is difficult to time the sale of the ship at the peak of the cycle and also purchase a ship at the bottom of the cycle but a value focused management has to put reasonable amount of effort in taking these capital allocation decision which are orbit changing for the shareholders if done properly.
Crude Tanker Prices
Dry Bulk Tanker Prices
Market Analysis FY 2017-18
Crude Tanker Market
The crude tanker market in FY18 witnessed lower earnings than FY17 due to the following factors:
- In November 2016 the OPEC and certain Non-OPEC nations decided to curtail production to help support the crude oil prices. By the end of FY 17 and throughout FY 18 the market witnessed a strong compliance to these allocated cuts.
- The reduced production led to the oil price increasing, however the forward curve remained in backwardation (as the market believes these oil prices are artificially held high). When the oil curve is in backwardation, oil consumers prefer to draw down from their inventory, which has occurred at the expense of trade.
- Fleet supply was a major challenge during the year due to a large number of new building vessels being delivered, floating storage (in vessels) being released and tankers trading in the clean sector switching to the dirty crude sector.
- Therefore the freight market was very weak throughout the year. This weakness should have led to increased scrapping but unfortunately it did not pick up until the fourth quarter.
Product Tanker Market
The product tanker market in FY 18 witnessed lower earnings than in FY 17 due to the following factors:
- Similar to the crude market, inventories in the product tanker market had also built up over the previous year. Therefore in FY 18, despite a healthy demand growth for products, trade growth was weaker than FY 17 as consumers relied upon drawing down inventories.
- Fleet growth was strong during the year with minimal scrapping.
- Clearly the year was challenging for product tankers as the dearth of cargoes and excess fleet was the perfect combination for a weak freight rate.
LPG Carrier Market
The rise of the gas market over the last few years has been broadly attributed to two major reasons:
- Increase in shale production in the US has led to a large amount of LPG being produced in the region. The export of this new supply of gas (especially to Asia) has led not only to trade growth but also tonne mile expansion. To put it in perspective, US exports grew from 1.8 Mn tons in 2006 to about 33 Mn tons in 2017.
- On the back of a very strong freight market in 2014-16, ship owners had ordered a large number of vessels, most of which were delivered in 2016 and 2017. The growth in trade demand was unable to keep pace, with FY 17 witnessing a softening of the freight market. The supply overhang, along with delivery of new vessels and limited scrapping. has led to a depressed freight market for FY 18.
Local demand in the US also picked up due to an extremely cold winter, as well as industrial demand for propane. As a result, local prices picked up, closing the arbitrage between the US and Asia. Therefore, while the fundamental story of exports to Asia remains strong, there was a slowdown in growth over the last year due to local factors.
Dry Bulk Carrier Market
Dry bulk markets began the financial year on a strong note. The market had suffered over the last few years due to excessive fleet supply; however FY 18 has seen an improvement in freight earnings.
The defining characteristic of the dry bulk market over the last few years is that it is intrinsically dependent on the growth in Chinese cargo volumes.
The following events lent strength to the market:
- Fiscal stimulus in China has supported steel demand, which in turn has supported iron ore imports.
- Due to a focus on reducing pollution from steel mills, China increased imports of high grade ore from longer haul destinations such as Brazil.
- Coal demand for China and other South East Asian countries was strong and aided by longer haul exports from the US.
- Some minor bulk commodities such as bauxite also played their part as China diversified its sources from longer haul destinations such as Guinea.
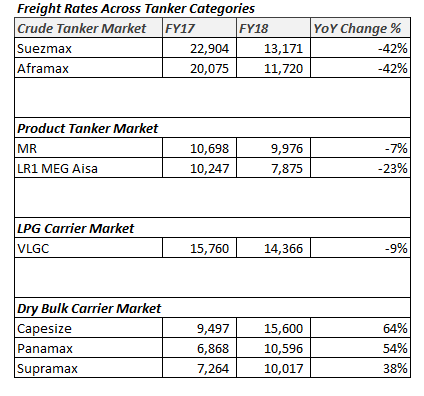
Freight rates swing wildly in one year as observed in the table above. In the dry bulk category when trade was strong and fleet growth declined, we experienced quantum jump in the TCE of the ships. Capesize category ships freight rates rose 64% to $15,600 in FY18.
Disclaimers :
The information herein is used as per the available sources of bseindia.com, company’s annual reports & other public database sources. Alpha Invesco is not responsible for any discrepancy in the above mentioned data. Investors should seek advice of their independent financial advisor prior to taking any investment decision based on this report or for any necessary explanation of its contents
Future estimates mentioned herein are personal opinions & views of the author. For queries / grievances – support@alphainvesco.com or call our support desk at 020-65108952.
SEBI registration No : INA000003106
Readers are responsible for all outcomes arising of buying / selling of particular scrip / scrips mentioned here in. This report indicates opinion of the author & is not a recommendation to buy or sell securities. Alpha Invesco & its representatives do not have any vested interest in above mentioned securities at the time of this publication, and none of its directors, associates have any positions / financial interest in the securities mentioned above.
Alpha Invesco, or it’s associates are not paid or compensated at any point of time, or in last 12 months by any way from the companies mentioned in the report.
Alpha Invesco & it’s representatives do not have more than 1% of the company’s total shareholding. Company ownership of the stock : No, Served as a director / employee of the mentioned companies in the report : No. Any material conflict of interest at the time of publishing the report : No.
The views expressed in this post accurately reflect the authors personal views about any and all of the subject securities or issuers; and no part of the compensations, if any was, is or will be, directly or indirectly, related to the specific recommendation or views expressed in the report.
Stay Updated With Our Market Insights.
Our Weekly Newsletter Keeps You Updated On Sectors & Stocks That Our Research Desk Is Currently Reading & Common Sense Approach That Works In Real Investment World.